By Alexander Arnon
The number of unauthorized immigrants in the U.S. has been falling for more than a decade. Growing rapidly in the late 1990s and 2000s, the unauthorized population peaked in 2007 at more than 12 million, or 4 percent of the U.S. population. Since then it has fallen by nearly 15 percent, reaching 10.5 million in 2017.1 PWBM expects the number of unauthorized immigrants to continue gradually declining over the next two decades and eventually stabilize around 9 million. By 2050, PWBM projects that unauthorized immigrants will make up less than 2.5 percent of the U.S. population, roughly the same share as in the mid-1990s.
Unauthorized immigration from Mexico has Fallen Sharply
The main reason for the decline in the unauthorized population since 2007 is a sharp fall in the number of Mexicans entering the U.S. illegally. Figure 1 shows PWBM’s estimates of the number of unauthorized immigrants who arrived in the U.S. in the previous years from different regions. Since the mid-2000s, the number of arrivals from Mexico has fallen about 75 percent. The drop began with the onset of the 2007-2009 recession and continued until 2012. In recent years, annual unauthorized arrivals from Mexico have been stable around 100 thousand.2
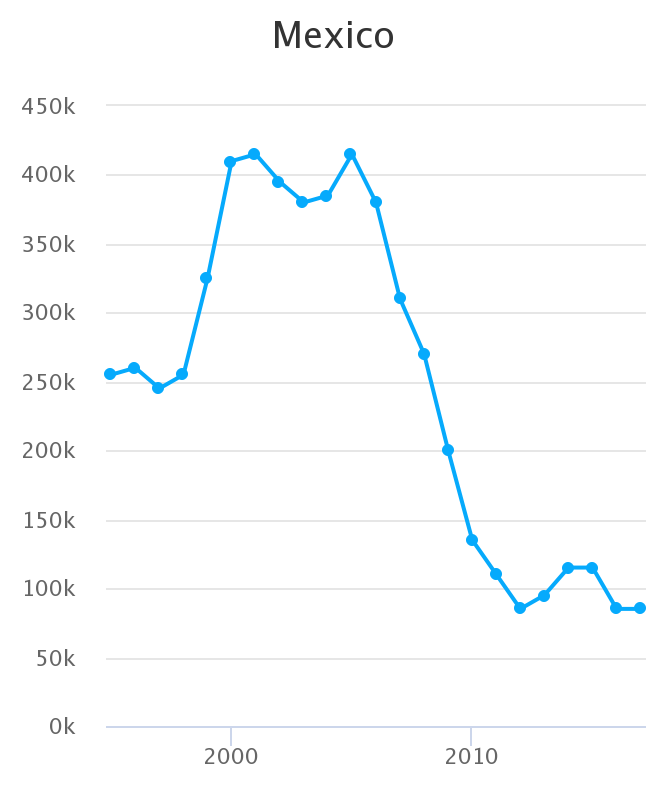
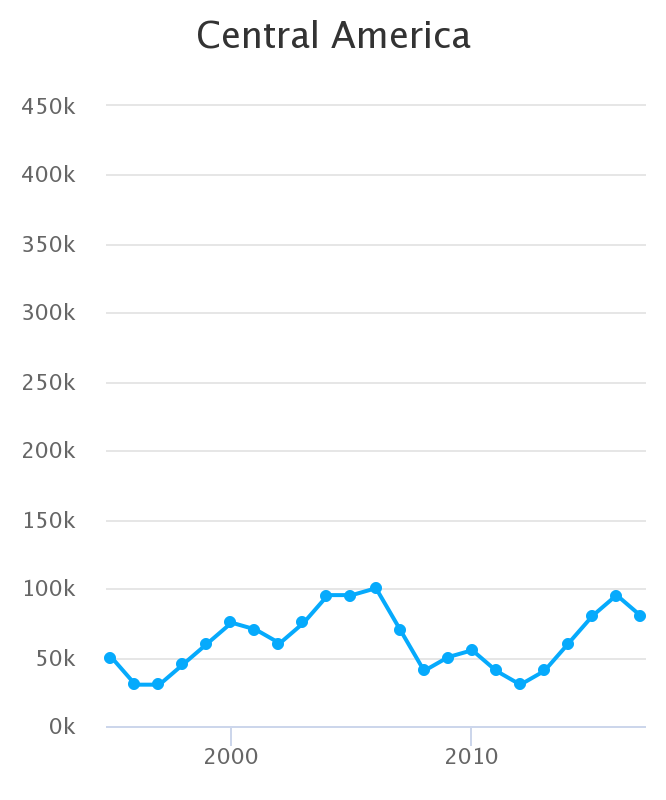
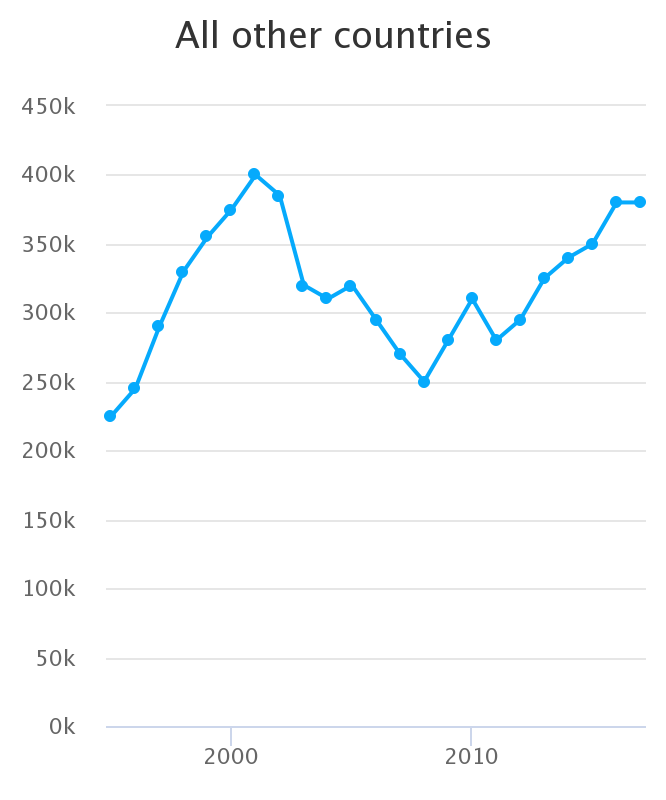
Source: PWBM based on augmented CPS ASEC and Pew Research Center.
Note: New arrivals refer to unauthorized immigrants who established residence in the U.S. in the previous year. Values are rounded to the nearest five thousand.
The fall in Mexican unauthorized immigration has been partially offset by increased unauthorized arrivals from the rest of the world. Between 2011 and 2016, unauthorized immigration from Central America doubled, while the number of arrivals from other countries rose by one quarter. Nevertheless, these increases have not been large enough to offset the decline from Mexico.
Number of Unauthorized immigrants Projected to Fall Until 2040 and Then Stabilizes
PWBM expects the number of unauthorized immigrants to continue gradually declining over the next two decades, falling below 10 million by the mid-2020s and reaching 9 million around 2040. Thereafter, the unauthorized population remains stable but continues falling as a share of the total U.S. population. By 2050, PWBM projects that unauthorized immigrants will make up less than 2.5 percent U.S. residents, roughly the same share as in the mid-1990s.
PWBM projects the number of unauthorized immigrants using a stochastic microsimulation model of the U.S. population and economy. Beginning with a representative sample of U.S. households drawn from survey data, the model simulates lifetime demographic and economic outcomes for each individual. The callout box provides a brief description of the model.
Figure 2 shows PWBM’s estimates of the unauthorized immigrant population since 1996 and its projected evolution through 2050. The blue line is PWBM’s estimate of the actual unauthorized population, derived from survey data using estimates and methods developed by the Pew Research Center. To verify that PWBM’s microsimulation captures the historical dynamics of the unauthorized population, the model was initialized with a sample of households from 1996 and simulated over the 22 years for which historical estimates are available, as well as future decades.3 The historical and future unauthorized population predicted by the microsimulation model is shown in red. The solid red line shows the average outcome from 50 simulations of the model, and the red shaded area shows the range between the highest and lowest outcomes for each year across all simulations. This range reflects random variation between different simulations of the same underlying process. Differences between values within the range are not meaningful.
Metric
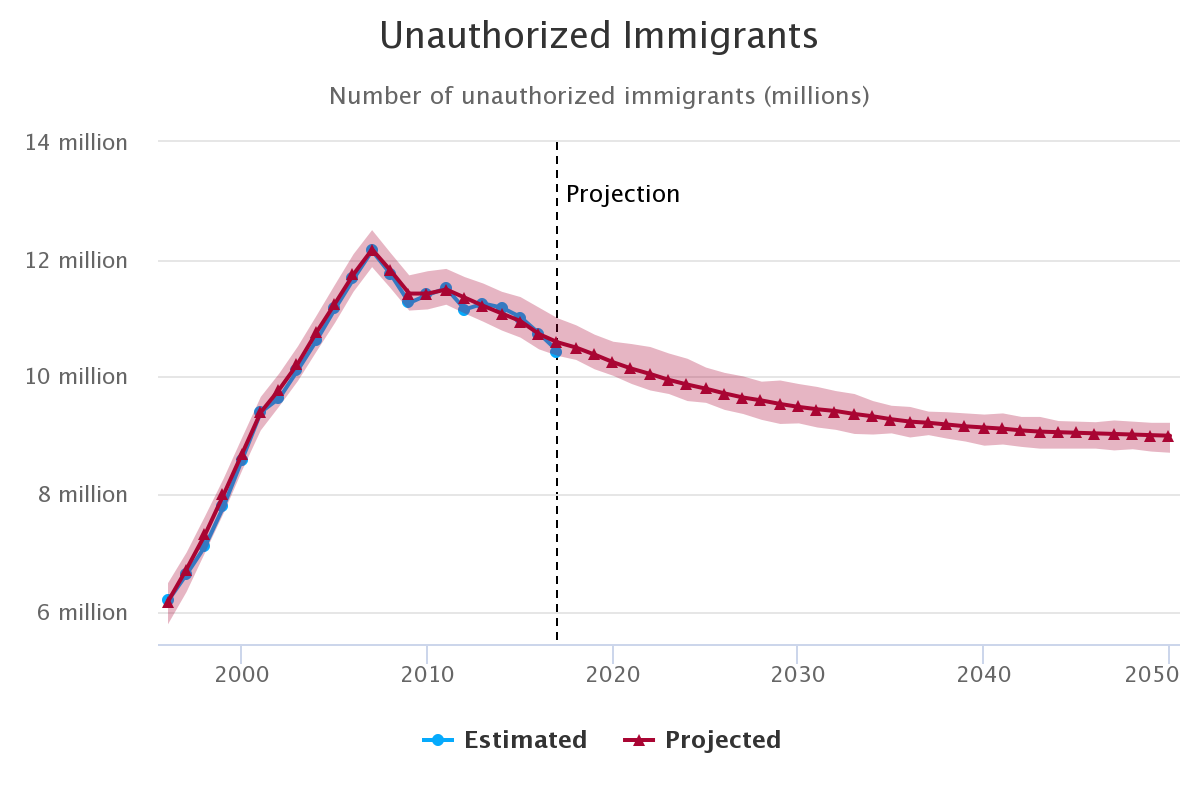
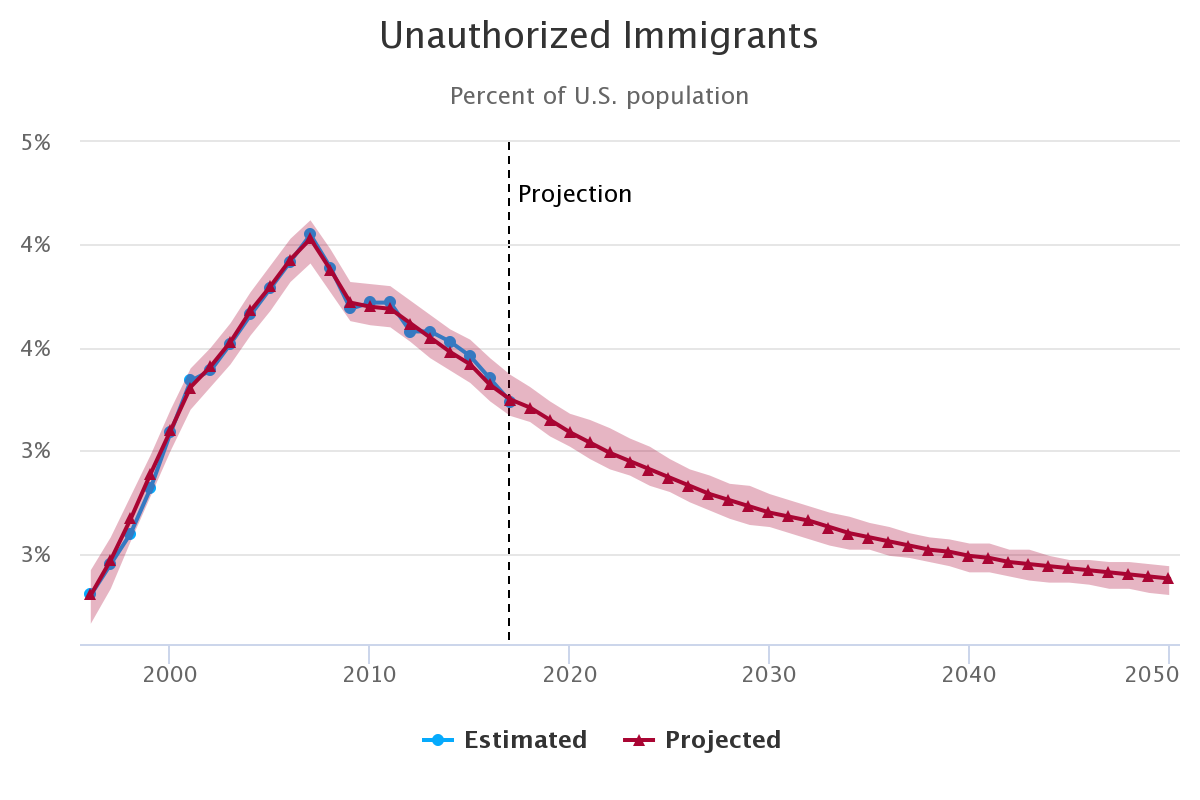
Source: PWBM based on augmented CPS ASEC, Pew Research Center, and the PWBM microsimulation model.
Note: The solid red line shows the average outcome from 50 simulations of PWBM's microsimulation model. The red shaded area shows the range between the highest and lowest outcomes for each year across all simulations.
The most important assumption underlying PWBM’s projections is that unauthorized immigration from Mexico and Central America will remain near current levels, rather than return to the much higher levels of the 1990s and early 2000s. Figure 3 shows the share of unauthorized arrivals coming from those countries since 1996 and in PWBM’s projections. In 2005, Mexicans and Central Americans made up more than 60 percent of recently arrived unauthorized immigrants. Since 2011, that share has been only about one third. PWBM interprets this decline as permanent and expects the share to remain within its recent range.
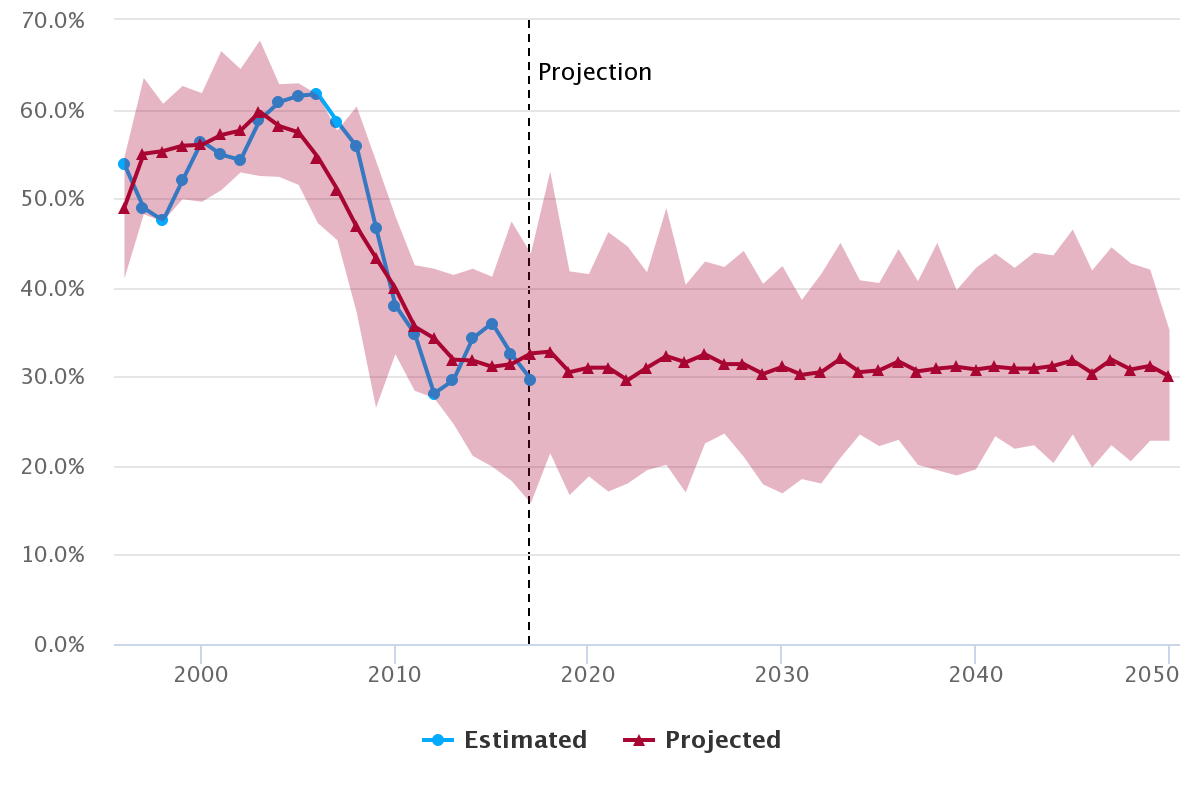
Source: PWBM based on augmented CPS ASEC, Pew Research Center, and the PWBM microsimulation model.
Note: The solid red line shows the average outcome from 50 simulations of PWBM's microsimulation model. The red shaded area shows the range between the highest and lowest outcomes for each year across all simulations. Arrivals refer to unauthorized immigrants who established residence in the U.S. in the previous year.
PWBM views past rates of illegal immigration across the southern border as unlikely to be repeated for two main reasons. Since the mid-2000s, policy changes and substantial investments in border security and interior enforcement have increased the difficulty of crossing the border, the costs of being apprehended and the likelihood of removal (deportation). In addition, improved relative economic conditions in Mexico likely account for much of the decline in Mexican immigration over the last decade. The stability of arrivals from Mexico since 2012 despite the economic recovery and the tight U.S. labor market of the last few years suggests that economic motives are no longer a source of large-scale Mexican migration.
The recent surge in Border Patrol apprehensions of Central Americans crossing Mexico to reach the U.S. border raises the possibility that the Northern Triangle countries – El Salvador, Guatemala and Honduras – will replace Mexico as a major source of unauthorized entrants. There is no way to know at this point how many have evaded apprehension and successfully entered the country without authorization. However, reports suggest that most of these migrants are presenting themselves to the Border Patrol and requesting asylum in the U.S. rather than attempting to cross the border illegally. In fact, the number of asylum applications from people born in the Northern Triangle countries has risen rapidly. It is still too early to determine what effect recent events at the border will have on the unauthorized population, but at this time, PWBM does not anticipate a sustained increase in unauthorized border crossings. PWBM will reassess its projections as the situation develops and additional data become available.
Growth in the Unauthorized Population Driven by Visa Overstays, Not Illegal Entry
Immigrants become unauthorized either by entering the U.S. without authorization – usually by crossing the southern border – or by entering the country legally on a temporary (nonimmigrant) visa and then failing to depart the U.S. when required to – referred to as a visa overstay. Immigrants from Mexico and Central America account for the vast majority of unauthorized entries, while most unauthorized immigrants from other countries are visa overstays. The shift in the origins of new unauthorized immigrants since the mid-2000s therefore implies a corresponding shift in the relative importance of the different modes of entry into the unauthorized population.
Figure 4 shows the annual percent change in the number of unauthorized immigrants and the contributions of various sources of entry into and exit out of the unauthorized immigrant population in PWBM’s simulations.4 Immigrants enter the unauthorized population either as unauthorized entries or as visa overstays. PWBM divides overstays into two categories: traveler visa overstays, who enter the U.S. for business or pleasure and are authorized to remain in the country, at most, a few months; and resident visa overstays, who enter for education, employment or other reasons and are authorized to remain for longer periods.5 Immigrants exit the unauthorized population either through death or emigration. Emigration includes voluntary departures, removals by the Department of Homeland Security (deportations) and unauthorized immigrants who leave the country and then return with valid visas.
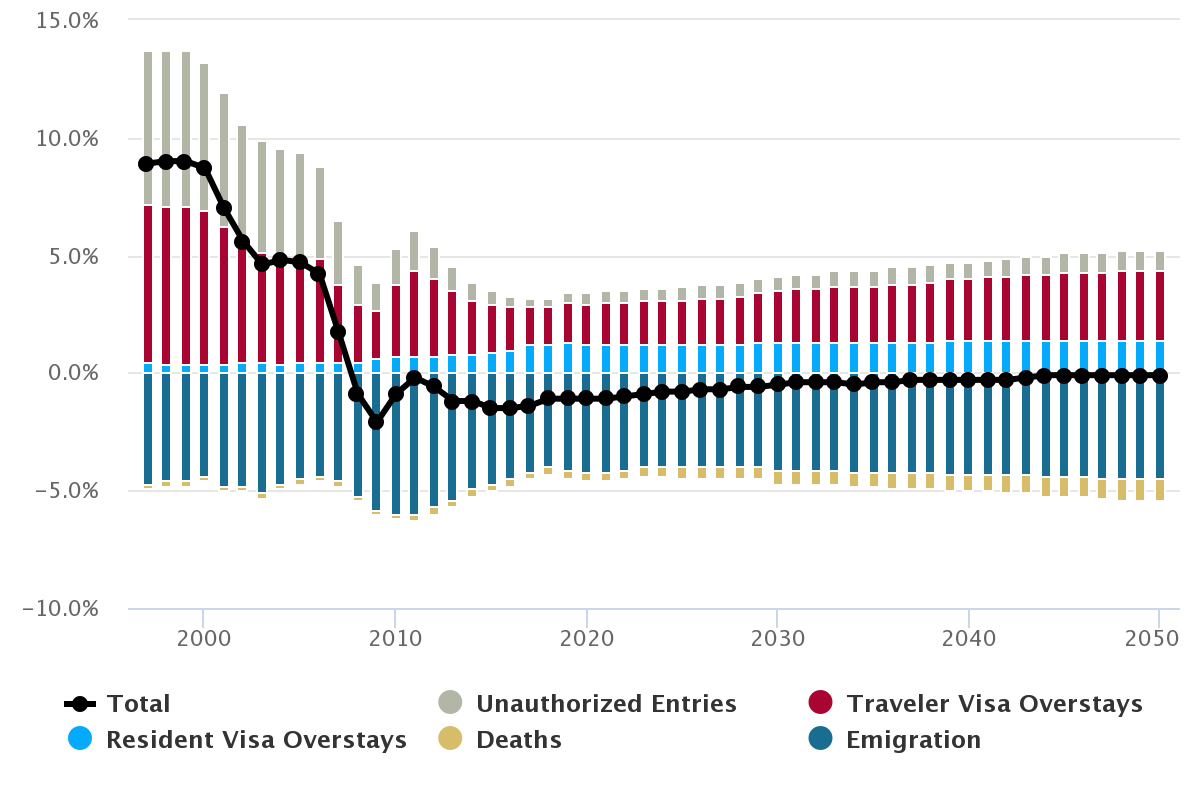
Source: PWBM microsimulation model.
Note: Average outcome from 50 simulations of PWBM's microsimulation model.
PWBM estimates that unauthorized entries and visa overstays added roughly equal numbers to the unauthorized population in the late 1990s and early 2000s. However, the number of unauthorized entries fell sharply after the mid-2000s as illegal immigration from Mexico and Central America declined.6 In recent years, more than three quarters of new unauthorized immigrants have been visa overstays, according to PWBM’s estimates. In PWBM’s projections, visa overstays remain the dominant mode of entry into the unauthorized population.
Until recently, nearly all visa overstays were traveler overstays – individuals who entered the U.S. legally for short-term business or pleasure travel and then stayed in the country without authorization. PWBM’s estimates suggest that these immigrants generally do not remain in the unauthorized population for very long, either leaving the U.S. permanently or returning with a valid visa. Traveler overstays therefore make up a larger share of new unauthorized arrivals than of the current unauthorized population. For example, PWBM estimates that traveler visa overstays accounted for about half of new arrivals in the late 1990s, but less than a third of unauthorized immigrants who arrived in the late 1990s and still resided in the U.S. in 2018.
The growing importance of resident visa overstays in recent years and in PWBM’s projections reflect two developments over the last decade. First, while the unauthorized population is declining, the number of lawful temporary immigrants residing in the U.S. – the pool of potential overstayers – is growing. Hence, even if the share who overstay remains the same, the impact of resident overstays on the growth of the unauthorized population will increase. Second, the share of lawful temporary immigrants coming from Asia, and particularly India and China, has increased. Based on data from the Department of Homeland Security, PWBM estimates that students and temporary workers from these countries tend to overstay at relatively high rates.
PWBM’s projections assume that about 1 percent of the unauthorized population is deported each year but incorporate a small increase in deportations over the next few years due to increased Immigration and Customs Enforcement activity.7 Voluntary emigration is expected to gradually rise over the next few decades because more of the unauthorized population will be visa overstays, who are less likely to settle in the U.S. permanently according to PWBM’s estimates. This increase is partially offset by declining emigration among earlier cohorts of unauthorized immigrants, who become less likely to emigrate the longer they reside in the U.S. Finally, PWBM expects the share of unauthorized immigrants who die each year to more than double as the unauthorized population ages.
Sources and Methods
PWBM’s historical estimates are primarily based on the Current Population Survey’s Annual Social and Economic Supplement (CPS ASEC). The survey provides basic information about immigrants, such as country of origin, year of arrival, and U.S. citizenship, but does not identify the legal status of noncitizens. To obtain estimates for the unauthorized population, PWBM assigns a legal status to all immigrants in the CPS ASEC sample. Drawing on estimates and methods developed by the Pew Research Center and on data from the Department of Homeland Security, immigrants are assigned to one of four legal status categories: naturalized citizen, lawful permanent resident, other lawful immigrant (referred to as a “nonimmigrant”) or unauthorized immigrant. In addition, the CPS population weights are adjusted to account for discontinuities in the original data, data revisions and undercounting of the foreign-born population. See PWBM’s model documentation for more information.
Projections and historical simulations are from PWBM’s stochastic microsimulation model of the U.S. population and economy. Beginning with a representative sample of U.S. households drawn from the CPS, the model simulates lifetime demographic and economic outcomes for each individual. These outcomes include marriage, childbirth, education, employment, earnings, geographic mobility, adjustments of legal status and death, for example. As the initial population drawn from the CPS dies off or emigrates, they are replaced by new generations who were born or immigrated within the simulation.
By simulating the evolution of each individual in a representative sample, microsimulation models can match the heterogeneity observed in the actual population and account for complex interactions between outcomes. Stochastic microsimulation models rely, in part, on randomness to replicate the real-world distribution of individual outcomes. For example, the likelihood that an individual will give birth depends on her age, marital status, and other attributes, but also on a variety of other factors not explicitly accounted for in the model. These factors are treated as random: different individuals with the same attributes have equal probability of giving birth in the model, but whether they actually do depends on an individualized random draw. Across the full range of simulated attributes and events, this random element means that two individuals who begin a year identical in terms of all observable characteristics can end the year having experienced very different outcomes.
Because the model is partly random, each simulation can generate different results even if all parameters and assumptions are the same. PWBM simulates the model many times and takes the average as its central estimate, using the variation across runs to assess the model’s precision. In Figures 2 and 3, the solid red line shows the average outcome from 50 runs of the microsimulation, while the red shaded area shows the range between the highest and lowest outcomes for each year across all simulations.
Immigration inflows and model parameters governing immigrants’ demographic and economic attributes are derived primarily from the augmented CPS ASEC. Model parameters governing emigration are based on Van Hook et al (2006), Schwabish (2011), Warren and Warren (2013), and data from the Department of Homeland Security. For a description of the sources and methods used to estimate and simulate visa overstays, see PWBM’s model documentation.
-
PWBM’s estimates of the size and characteristics of the unauthorized immigrant population are based on the Current Population Survey’s Annual Social and Economic Supplement (CPS ASEC) and on prior work by Jeffrey Passel and D’Vera Cohn of the Pew Research Center. PWBM replicates much of the process Passel and Cohn have developed to identify unauthorized immigrants in survey data and uses their estimates as targets for assigning legal status. Additional information on PWBM’s legal status assignment methodology is available here. ↩
-
PWBM’s estimates only include unauthorized immigrants who reside in a U.S. household. Immigrants who are apprehended attempting to enter the U.S. and either detained or returned to their country of origin, as well as most of those who enter without authorization but depart within a few months, are not counted. Hence, the numbers in Figure 1 are probably lower than the number of people entering or attempting to enter the country illegally each year, especially in the 1990s and early 2000s, when seasonal labor migration was more frequent. ↩
-
The historical simulation is based on PWBM’s estimates of migration flows since the mid-1990s. Because there is no detailed historical data on these flows, PWBM estimates them using a variety of sources; see the callout box and model documentation for more information.
The projection is simply the continuation of the historical simulation, replacing estimated historical flows with forecasted future flows. Hence, any prediction errors accumulated over the historical simulation are carried forward through the projection. Normally, PWBM does not run historical simulations when generating projections; instead, the model is initialized with a representative sample of households drawn from the most recent survey data and the simulation is run for the projection period only. The historical simulation is included here for illustrative purposes, even though this simulation results in slightly different projections. ↩
-
Growth rates in Figure 4 were smoothed using a three-year moving average. ↩
-
For a description of the sources and methods used to estimate and simulate visa overstays, see PWBM’s model documentation. ↩
-
As seen in Figure 1 unauthorized entries from Central America have since returned to early-2000’s levels. ↩
-
Removals of unauthorized immigrants by Immigration and Customs Enforcement increased 45 percent from 2016 to 2018 but remain much lower than a decade ago. ↩
  Year,Mexico
  1995,255
  1996,260
  1997,245
  1998,255
  1999,325
  2000,410
  2001,415
  2002,395
  2003,380
  2004,385
  2005,415
  2006,380
  2007,310
  2008,270
  2009,200
  2010,135
  2011,110
  2012,85
  2013,95
  2014,115
  2015,115
  2016,85
  2017,85
  Year,Central America
  1995,50
  1996,30
  1997,30
  1998,45
  1999,60
  2000,75
  2001,70
  2002,60
  2003,75
  2004,95
  2005,95
  2006,100
  2007,70
  2008,40
  2009,50
  2010,55
  2011,40
  2012,30
  2013,40
  2014,60
  2015,80
  2016,95
  2017,80
  Year,All other countries
  1995,225
  1996,245
  1997,290
  1998,330
  1999,355
  2000,375
  2001,400
  2002,385
  2003,320
  2004,310
  2005,320
  2006,295
  2007,270
  2008,250
  2009,280
  2010,310
  2011,280
  2012,295
  2013,325
  2014,340
  2015,350
  2016,380
  2017,380
  Year,Estimated,Projected,{Projected min},{Projected max}
  1996,6.19,6.18,5.79,6.49
  1997,6.64,6.73,6.34,7.01
  1998,7.12,7.32,7.01,7.63
  1999,7.80,8.00,7.68,8.27
  2000,8.60,8.70,8.41,8.97
  2001,9.40,9.40,9.09,9.66
  2002,9.64,9.79,9.50,10.06
  2003,10.12,10.23,9.93,10.52
  2004,10.62,10.76,10.43,11.04
  2005,11.16,11.25,10.92,11.57
  2006,11.67,11.75,11.45,12.09
  2007,12.15,12.17,11.87,12.50
  2008,11.75,11.81,11.51,12.11
  2009,11.26,11.42,11.13,11.73
  2010,11.40,11.42,11.15,11.80
  2011,11.51,11.49,11.23,11.84
  2012,11.15,11.35,11.08,11.70
  2013,11.25,11.21,10.94,11.59
  2014,11.18,11.08,10.79,11.45
  2015,11.02,10.95,10.67,11.36
  2016,10.74,10.73,10.47,11.18
  2017,10.44,10.59,10.36,11.00
  2018,,10.50,10.29,10.88
  2019,,10.38,10.13,10.72
  2020,,10.25,10.02,10.60
  2021,,10.14,9.88,10.56
  2022,,10.05,9.77,10.51
  2023,,9.95,9.71,10.40
  2024,,9.87,9.59,10.31
  2025,,9.80,9.56,10.16
  2026,,9.72,9.44,10.07
  2027,,9.65,9.37,10.01
  2028,,9.60,9.27,9.92
  2029,,9.54,9.20,9.94
  2030,,9.49,9.21,9.88
  2031,,9.45,9.14,9.83
  2032,,9.42,9.10,9.76
  2033,,9.37,9.03,9.71
  2034,,9.33,9.02,9.59
  2035,,9.28,9.04,9.51
  2036,,9.24,8.97,9.49
  2037,,9.22,9.01,9.41
  2038,,9.19,8.95,9.40
  2039,,9.16,8.90,9.38
  2040,,9.14,8.83,9.36
  2041,,9.12,8.85,9.38
  2042,,9.09,8.81,9.32
  2043,,9.07,8.78,9.32
  2044,,9.06,8.78,9.25
  2045,,9.05,8.78,9.24
  2046,,9.04,8.78,9.23
  2047,,9.03,8.75,9.26
  2048,,9.02,8.77,9.24
  2049,,9.01,8.73,9.22
  2050,,9.00,8.71,9.22
  Year,Estimated,Projected,{Projected min},{Projected max}
  1996,0.023,0.023,0.0216,0.0242
  1997,0.0245,0.0247,0.0233,0.0258
  1998,0.026,0.0267,0.0256,0.0278
  1999,0.0282,0.0289,0.0278,0.0298
  2000,0.0309,0.031,0.03,0.032
  2001,0.0334,0.0331,0.032,0.034
  2002,0.0339,0.0341,0.0331,0.035
  2003,0.0352,0.0353,0.0342,0.0362
  2004,0.0366,0.0368,0.0356,0.0377
  2005,0.0379,0.038,0.0368,0.039
  2006,0.0392,0.0393,0.0382,0.0403
  2007,0.0405,0.0403,0.0391,0.0412
  2008,0.0389,0.0388,0.0377,0.0398
  2009,0.0369,0.0372,0.0363,0.0382
  2010,0.0372,0.037,0.0361,0.0381
  2011,0.0372,0.0369,0.036,0.038
  2012,0.0358,0.0362,0.0353,0.0373
  2013,0.0358,0.0355,0.0345,0.0366
  2014,0.0353,0.0348,0.0339,0.0359
  2015,0.0346,0.0342,0.0333,0.0354
  2016,0.0335,0.0332,0.0324,0.0345
  2017,0.0324,0.0325,0.0317,0.0337
  2018,,0.0321,0.0314,0.0331
  2019,,0.0315,0.0307,0.0324
  2020,,0.0309,0.0302,0.0318
  2021,,0.0304,0.0296,0.0315
  2022,,0.0299,0.0291,0.0311
  2023,,0.0295,0.0288,0.0306
  2024,,0.0291,0.0283,0.0302
  2025,,0.0287,0.028,0.0296
  2026,,0.0283,0.0275,0.0291
  2027,,0.0279,0.0271,0.0288
  2028,,0.0276,0.0267,0.0284
  2029,,0.0273,0.0264,0.0283
  2030,,0.027,0.0263,0.0279
  2031,,0.0268,0.026,0.0276
  2032,,0.0266,0.0257,0.0273
  2033,,0.0263,0.0254,0.027
  2034,,0.026,0.0252,0.0268
  2035,,0.0258,0.0252,0.0265
  2036,,0.0256,0.0249,0.0263
  2037,,0.0254,0.0248,0.026
  2038,,0.0252,0.0246,0.0258
  2039,,0.0251,0.0244,0.0257
  2040,,0.0249,0.0241,0.0255
  2041,,0.0248,0.0241,0.0255
  2042,,0.0246,0.0239,0.0252
  2043,,0.0245,0.0237,0.0252
  2044,,0.0244,0.0236,0.0249
  2045,,0.0243,0.0236,0.0247
  2046,,0.0242,0.0235,0.0247
  2047,,0.0241,0.0233,0.0246
  2048,,0.024,0.0233,0.0246
  2049,,0.0239,0.0231,0.0245
  2050,,0.0238,0.023,0.0244
  Year,Estimated,Projected,{Projected min},{Projected max}
  1996,0.538,0.490,0.410,0.546
  1997,0.489,0.550,0.482,0.635
  1998,0.475,0.553,0.474,0.606
  1999,0.520,0.559,0.499,0.626
  2000,0.564,0.560,0.496,0.618
  2001,0.549,0.571,0.509,0.665
  2002,0.543,0.576,0.529,0.645
  2003,0.588,0.597,0.525,0.677
  2004,0.608,0.581,0.524,0.628
  2005,0.615,0.574,0.515,0.629
  2006,0.617,0.546,0.472,0.616
  2007,0.586,0.510,0.453,0.576
  2008,0.558,0.468,0.372,0.603
  2009,0.467,0.433,0.265,0.542
  2010,0.380,0.399,0.325,0.480
  2011,0.348,0.356,0.284,0.425
  2012,0.281,0.343,0.276,0.421
  2013,0.296,0.319,0.247,0.414
  2014,0.343,0.318,0.211,0.421
  2015,0.360,0.311,0.199,0.412
  2016,0.325,0.314,0.183,0.474
  2017,0.297,0.326,0.158,0.438
  2018,,0.328,0.214,0.530
  2019,,0.305,0.167,0.418
  2020,,0.310,0.188,0.415
  2021,,0.310,0.171,0.462
  2022,,0.296,0.180,0.446
  2023,,0.310,0.195,0.417
  2024,,0.323,0.201,0.489
  2025,,0.316,0.170,0.403
  2026,,0.325,0.225,0.429
  2027,,0.314,0.236,0.423
  2028,,0.314,0.210,0.441
  2029,,0.303,0.179,0.404
  2030,,0.311,0.169,0.424
  2031,,0.302,0.185,0.386
  2032,,0.305,0.180,0.415
  2033,,0.320,0.209,0.450
  2034,,0.305,0.235,0.408
  2035,,0.307,0.222,0.405
  2036,,0.317,0.229,0.443
  2037,,0.306,0.201,0.407
  2038,,0.309,0.195,0.450
  2039,,0.311,0.189,0.397
  2040,,0.308,0.196,0.422
  2041,,0.311,0.233,0.438
  2042,,0.309,0.219,0.422
  2043,,0.309,0.223,0.439
  2044,,0.312,0.203,0.436
  2045,,0.318,0.235,0.465
  2046,,0.304,0.198,0.419
  2047,,0.319,0.223,0.445
  2048,,0.308,0.205,0.427
  2049,,0.312,0.228,0.420
  2050,,0.300,0.228,0.352
  Year,Total,Unauthorized Entries,Traveler Visa Overstays,Resident Visa Overstays,Deaths,Emigration
  1997,0.089,0.065,0.067,0.005,-0.002,-0.047
  1998,0.090,0.066,0.067,0.004,-0.002,-0.046
  1999,0.090,0.066,0.067,0.004,-0.002,-0.046
  2000,0.087,0.063,0.065,0.004,-0.002,-0.044
  2001,0.070,0.057,0.058,0.004,-0.002,-0.048
  2002,0.056,0.051,0.050,0.005,-0.002,-0.048
  2003,0.046,0.048,0.046,0.005,-0.002,-0.051
  2004,0.048,0.047,0.045,0.004,-0.002,-0.047
  2005,0.047,0.044,0.045,0.005,-0.002,-0.045
  2006,0.042,0.039,0.044,0.005,-0.002,-0.044
  2007,0.017,0.027,0.033,0.005,-0.002,-0.046
  2008,-0.009,0.017,0.024,0.005,-0.002,-0.052
  2009,-0.021,0.012,0.021,0.006,-0.002,-0.058
  2010,-0.009,0.015,0.031,0.007,-0.002,-0.060
  2011,-0.002,0.017,0.037,0.007,-0.003,-0.060
  2012,-0.006,0.014,0.033,0.007,-0.003,-0.057
  2013,-0.012,0.010,0.027,0.008,-0.003,-0.054
  2014,-0.012,0.008,0.023,0.008,-0.003,-0.049
  2015,-0.015,0.006,0.020,0.009,-0.003,-0.047
  2016,-0.015,0.005,0.018,0.010,-0.003,-0.045
  2017,-0.014,0.004,0.016,0.012,-0.003,-0.042
  2018,-0.011,0.004,0.016,0.012,-0.003,-0.040
  2019,-0.011,0.004,0.017,0.013,-0.004,-0.041
  2020,-0.011,0.005,0.017,0.012,-0.004,-0.042
  2021,-0.011,0.005,0.018,0.012,-0.004,-0.042
  2022,-0.010,0.005,0.018,0.012,-0.004,-0.041
  2023,-0.009,0.005,0.019,0.012,-0.004,-0.040
  2024,-0.008,0.005,0.019,0.012,-0.004,-0.040
  2025,-0.008,0.006,0.019,0.012,-0.005,-0.040
  2026,-0.007,0.006,0.020,0.012,-0.005,-0.040
  2027,-0.007,0.006,0.020,0.012,-0.005,-0.040
  2028,-0.006,0.006,0.021,0.012,-0.005,-0.040
  2029,-0.006,0.006,0.021,0.013,-0.005,-0.040
  2030,-0.005,0.006,0.022,0.013,-0.006,-0.041
  2031,-0.004,0.006,0.023,0.013,-0.006,-0.041
  2032,-0.004,0.006,0.023,0.013,-0.006,-0.041
  2033,-0.004,0.007,0.024,0.013,-0.006,-0.041
  2034,-0.005,0.007,0.024,0.013,-0.006,-0.042
  2035,-0.004,0.007,0.024,0.013,-0.006,-0.042
  2036,-0.004,0.007,0.025,0.013,-0.007,-0.042
  2037,-0.003,0.007,0.025,0.013,-0.007,-0.042
  2038,-0.003,0.007,0.026,0.013,-0.007,-0.042
  2039,-0.003,0.007,0.026,0.014,-0.007,-0.043
  2040,-0.003,0.007,0.026,0.014,-0.007,-0.043
  2041,-0.003,0.007,0.027,0.014,-0.007,-0.043
  2042,-0.003,0.008,0.027,0.014,-0.008,-0.043
  2043,-0.002,0.008,0.028,0.014,-0.008,-0.043
  2044,-0.001,0.008,0.028,0.014,-0.008,-0.044
  2045,-0.001,0.008,0.029,0.014,-0.008,-0.044
  2046,-0.001,0.008,0.029,0.014,-0.008,-0.044
  2047,-0.001,0.008,0.029,0.014,-0.008,-0.045
  2048,-0.001,0.008,0.030,0.014,-0.009,-0.045
  2049,-0.001,0.008,0.030,0.014,-0.009,-0.045
  2050,-0.001,0.008,0.030,0.014,-0.009,-0.045