By Christine Park
Yahoo Finance editor Adriana Belmonte reports on the effects of increasing immigration on the American workforce. Belmonte cites PWBM’s interview on Knowledge@Wharton Business Radio SiriusXM 132, along with a policy brief written by Georgetown University professor Harry Holzer and the U.S. Census data, to illustrate the effects of increasing immigration on the U.S. economy. She refers to PWBM to demonstrate that increased immigration can lead to a rise in GDP.
PWBM shows that recent immigrants are better educated than ever before. Since 2007, the share of immigrants with a college degree grew while the share without a high school degree fell (Figure 1). Among legal immigrants who arrived since 2014, half held a bachelor’s or advanced degree, compared to a third of native-born Americans. In addition, PWBM’s Immigration Policy Simulator suggests that increasing the flow of legal immigrants will have a positive impact on employment, GDP, and GDP per capita. The simulator also indicates that “the largest positive impact on employment would come from increasing the net flow of immigrants.”
Immigration is proving to be a key part of policy platforms for 2020 Presidential election candidates. You can use PWBM’s Interactive Immigration State Map to learn about immigration in your state.
Figure 1: Educational attainment of recent immigrants
Percent of immigrants aged 25 and older who arrived in the previous 5 years
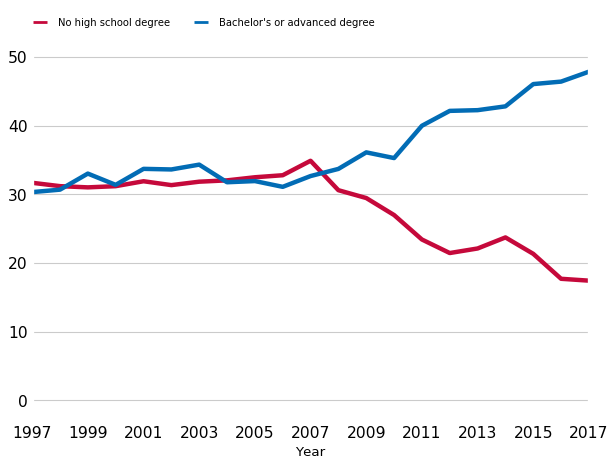
Source: PWBM calculations based on Current Population Survey Annual Social and Economic Supplement, 1997-2017.
  Year,No high school degree,Bachelor's or advanced degree
  1997,31.67951,30.32166
  1998,31.19011,30.68057
  1999,31.01283,33.01889
  2000,31.18653,31.37709
  2001,31.90356,33.70778
  2002,31.34068,33.62067
  2003,31.83888,34.32307
  2004,32.03357,31.75735
  2005,32.48421,31.92799
  2006,32.77914,31.08915
  2007,34.88388,32.65837
  2008,30.60129,33.69902
  2009,29.45883,36.10853
  2010,26.98403,35.27859
  2011,23.42236,39.98163
  2012,21.45318,42.14853
  2013,22.11701,42.25308
  2014,23.72578,42.80817
  2015,21.33446,46.04929
  2016,17.70347,46.41018
  2017,17.43114,47.85938