Forbes’ senior contributor Kelly Phillips Erb wrote about the sharp fall in charitable contributions claimed by taxpayers in 2018. Recent data from the Internal Revenue Service (IRS) reveals that in 2018, charitable deductions claimed by taxpayers fell by $37 billion compared to 2017.
Erb attributes the drop to the 2017 tax reform, or the Tax Cuts and Jobs Act (TCJA), which reduced tax incentives for charitable contributions in two ways. First, the TCJA limited certain itemized deductions and expanded the size of the standard tax deduction. Second, the TCJA lowered marginal tax rates, which increases the after-tax price of charitable contributions as a result. Erb cites PWBM research, which projected a 5.1 percent reduction in total charitable giving due to the TCJA.
PWBM followed up with an analysis of proposed policies aimed at expanding charitable giving in the wake of the TCJA. Such policies range from non-itemizer charitable deductions to non-refundable credits for charitable contributions for filers who do not itemize. PWBM modelled the effect of these policies on federal tax revenue and charitable contributions, for both high and low-income households. All the examined policies increase charitable giving at the expense of tax revenue. Policies that provide larger incentives for charitable giving cost more but also boost charitable giving more.
Figure 1: The Effect of the Policies that Expand Tax Benefits for Charitable Contributions on Federal Tax Revenue and Charitable Contributions Relative to Current Policy
Metric
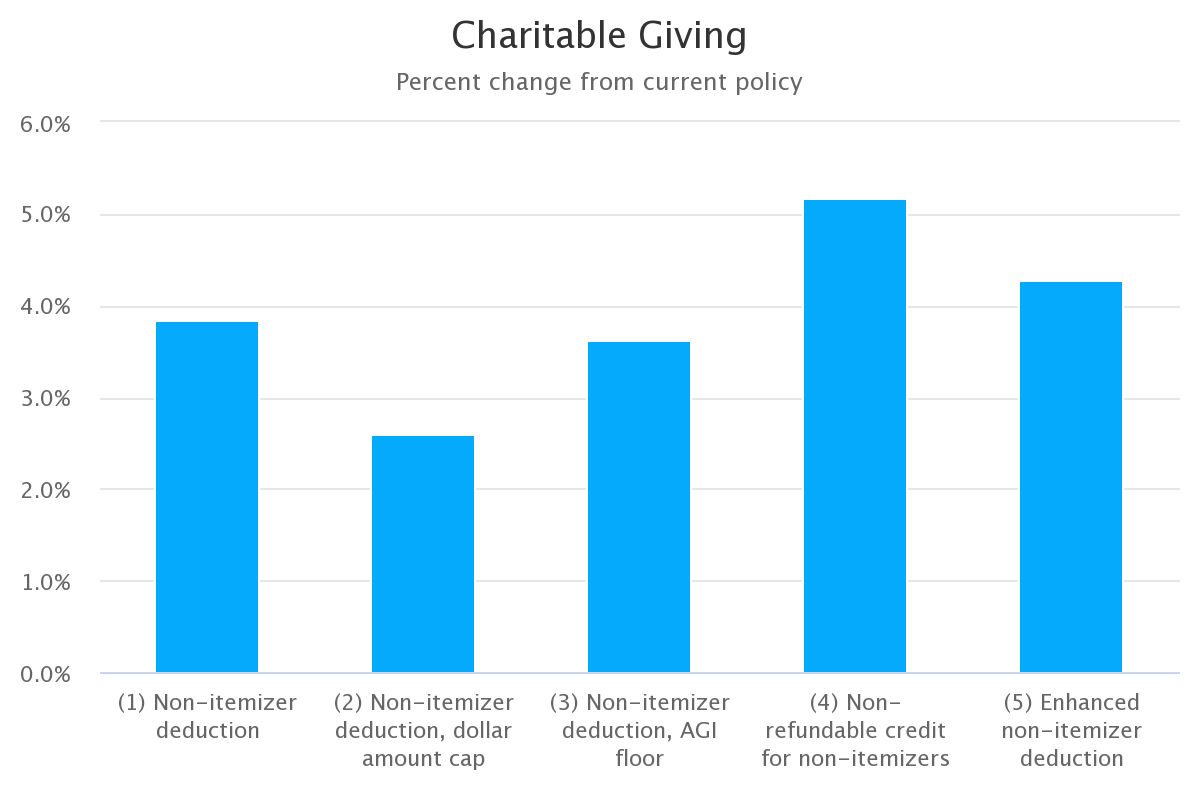


Source: Penn Wharton Budget Model. Projections made using the Wharton Integrated Tax Simulator.
Notes: Policies take effect in 2020. Years are calendar year concept for the charitable giving projections and fiscal year concept for the revenue projections. Tax price elasticities used: "low" = -0.5; "high" -1.0; "income-based" = -2.236 for tax units under $50K in 2017 AGI, -1.49 under $100K, and -1.182 over $100K. High tax price elasticity shown on Figure 1. Projections using other elasticities can be found in the data file. Due to rounding, numbers presented throughout this document may not add up precisely to the totals provided and percentages may not precisely reflect the absolute figures.