
Key Points
Tax cuts and higher life expectancy have reduced estate tax revenues over the last two decades, outweighing revenue gains from an older population and strong asset price gains.
Growing levels of tax avoidance and/or evasion likely contributed to falling estate tax revenues over this period.
Under a counterfactual scenario where the 2000 tax code was in effect for tax year 2019, the estate tax would have generated 9 times as much tax liability ($85B counterfactual vs $9B actual) and 100 times as many taxable estates (127,000 counterfactual vs 1,275 actual).
Decomposing the Decline in Estate Tax Liability Since 2000
The federal estate tax, which assesses a tax on the value of assets transferred at death, has diminished in scope over the last two decades. Major tax legislation enacted in 2001 and in 2017 cut estate tax revenue, primarily by limiting the number of estates subject to the tax. Other changes in the US economy during this period should have increased estate tax liability. These factors include population aging, more household saving driven by income growth, and rising asset prices.
Still, as shown in Figure 1, the estate tax liability as a share of GDP fell to less than one quarter of its 2001 level following the 2017 tax act. Taxable estates at death (as a share of total deaths) fell almost 98 percent from the 2001 level. In filing year 2001, nearly 52,000 estates owed a total of $23.5 billion in taxes. Twenty years later, just under 1,300 taxable estates were taxable, owing a collective $9.3 billion.


What key factors explain the decline in estate tax revenue? How much additional revenue would the estate tax raise if the estate tax cuts from the last twenty years were never enacted? How many more estates would be taxed? We answer these questions by decomposing the observed change in estate taxes into demographic, economic, and tax-related factors.
Estate tax law has undergone several significant changes since 2000. The exemption (the amount of wealth transfers above which tax applies) was raised by gradual increments throughout the 2000s and then by larger steps in 2012 and in 2017. This growth limited the number of estates subject to tax. The top estate tax rate was also lowered during this time period.

The Economic Growth and Tax Relief Reconciliation Act of 2001 (EGGTRA) scheduled a series of exemption increases, starting at $675,000 in 2001 and ending at $3.5 million in 2009 before temporarily repealing the tax entirely in 2010.1 In addition, the top estate tax rate was lowered from 45 to 35 percent. EGGTRA’s provisions were written with a “sunset clause” such that, in 2011, the estate tax would be re-introduced at its 2001 law parameters.
The American Taxpayer Relief Act (ATRA) of 2012 made permanent the $5.12 million exemption for 2012 and indexed it to inflation thereafter. ATRA also raised the top tax rate to 40 percent beginning in 2013. This increase in the top tax rate was the only revenue-raising change to the exemption or rate of the estate tax law over this period.
The permanent changes put in place by ATRA were temporarily modified under the Tax Cuts and Jobs Act (TCJA) in 2017. For tax years 2018 through 2025, the exemption was doubled to $11.4 million. After 2025, the exemption threshold reverts to the inflation-adjusted amount defined by ATRA (PWBM projects the value will be roughly $7 million).
Structural forces in the economy affect tax revenues even when tax law is unchanged. For example, lower unemployment bolsters payroll tax revenues, inflation raises the nominal value of receipts, and real economic growth raises income taxes by pushing households into higher brackets.
The estate tax is unique in its sensitivity to certain nontax factors. First, it depends directly on the number of deaths, which in turn depends on the age distribution of the population. Second, unlike most federal taxes in the US, the base of the estate tax is wealth rather than income. Wealth is more volatile than income due to the dynamic nature of financial markets.
We model the change in the estate tax (both liability and the number of taxable estate tax returns) as a function of changes in the following factors:
- Demographic changes. Relative to 2000, the population is larger and older. Advances in public health and medicine have led to longer average lifespans.
- Economic changes. Estate wealth generally grows with overall changes in asset prices, which we further decompose into inflationary gains and real price revaluations. Household saving—the amount households have after earning income, paying taxes, and spending on consumption—also affects wealth held at death. Lastly, inequality as measured by wealth shares has increased since 2000.
- Tax-related changes. As discussed above, several rounds of tax legislation have cut effective estate tax rates since 2000. Sophisticated techniques to avoid estate taxes grew in popularity during this period, coinciding with a shrinking real IRS budget. Together, these factors may have reduced the amount of wealth subject to taxation.
- Unexplained factors. Any remaining change in estate taxes since 2000 not explained by the above factors is considered “unexplained”, represented as a residual.
The total effect on estate tax revenue becomes the aggregation of the above factors: (1A) Population growth, (1B) population aging, (1C) improved longevity, (2A) inflation, (2B) real asset price growth, (2C) real accumulation of assets, (2D) wealth concentration, (3A) tax cuts, (3B) tax planning, and (4) unexplained changes.
We measure the contribution of each factor by performing a shift-share analysis, a type of statistical exercise that isolates the impact of different forces causing a change to a variable over time. The model combines survey microdata on demographic characteristics and wealth, demographic-specific mortality rates from the CDC, financial flows data from the Federal Reserve, and estate tax data from the IRS to simulate estate tax microdata for tax years 2000-2019. We then measure the impact of a given factor by running the simulation and holding that sub-factor constant at its 2000 level. Refer to the Methodological Appendix below for further details.
Figure 3 shows how much each factor contributed to (or subtracted from) the change in the estate tax since filing year 2001, both for liability and the number of taxable estates. Bars above zero represent factors that boosted estate tax liability and number of taxable estates, while bars below zero indicate factors that reduced estate tax liability and number of taxable estates. The results are stacked; that is, effects of a given factor are evaluated against a baseline that includes the effects of all factors listed above it in the stacking order. In this way, the contributions of all factors sum to the total change since filing year 2001.


The US population has grown larger and older since 2000 (factors 1A and 1B, respectively). These changes mechanically generate more taxable estates, all else equal. Figure 3 shows these factors were a steady, if relatively minor, boost to the federal estate tax.
On the other hand life expectancy has risen, leading to fewer deaths and thus lower estate tax revenue. Furthermore, the decline in mortality risk has been concentrated among those with more economic and social resources—the type of people most likely to be subject to the estate tax. Research based on administrative data shows that higher-income individuals are less likely to die at any age than lower-income individuals, and that this effect increased over the period from 2001 to 2014. Similarly, prior PWBM analyses have demonstrated a growing longevity premium to education. We rely on this research to estimate a trend in the reduction of mortality from higher income. We then simulate consequences from this longevity effect on estate taxes by holding mortality rates fixed at 2000 levels; see the Methodological Appendix for further detail.
The base of the estate tax is wealth held at time of death. Wealth can be decomposed into the number of assets that have been accumulated and their current market price.
Asset price changes can further be decomposed into inflationary and real components. Figure 3 shows that consumer price inflation (factor 2A), as measured by the PCE price deflator, was a steady boon for estate taxes throughout the period. Inflation averaged 1.9 percent from 2000 through 2019, falling below 0 just once and never reaching 3 percent. This effect increased nominal estate tax liability.
On the other hand, real asset revaluations (factor 2B) played a larger and higher-variance role. We calculate asset price changes as the inflation-adjusted change in the market value of household sector assets net of acquisitions; see the Methodological Appendix for details. Figure 3 shows how a correction in the stock market weighed on the estate tax after the dot-com bubble. Similarly, asset prices—most notably home prices—plummeted during the Great Financial Crisis, wiping out the cumulative positive contributions to the estate tax from the prior decade. The economic recovery and falling interest rates resulted in large capital gains across all asset classes in the 2010s, generating more estate tax liability and pushing more estates into taxable status.
During the period studied, real household market incomes and government deficits grew, each of which increases household sector saving all else equal. We calculate households’ real accumulation of assets (factor 2C) as the residual change in wealth after accounting for inflation and real asset price revaluations. Figure 3 shows that household saving added to estate tax revenues.
Though the precise magnitude of wealth concentration (factor 2D) is debated, scholars agree that the distribution of wealth has grown more unequal over the previous two decades. The triennial Survey of Consumer Finances, the main data source for our simulation, shows that the share of wealth held by the bottom 90 percent of households fell from 30 percent in 2001 to 24 percent in 2019. At the same time, the share of wealth held by the top 1 percent rose 5 percentage points (from 32 to 37 percent).
Measured against a baseline where the 2000 tax code was in place (as in Figure 3 where tax changes are stacked), wealth concentration reduced the number of taxable estates—the result of lower wealth for those estates on the margin of the exemption. When measured against an actual-law baseline (not pictured in Figure 3), the result flips: higher average net worth for those in the top 1 percent pushed some estates over the higher exemption thresholds of the 2010s. In either case, trends in inequality over this period increased estate tax revenues, due to the progressive rate structure of the estate tax and the increased number of very wealthy estates.
Tax “avoidance” refers to a broad set of legal means through which taxpayers reduce their tax bill. In the context of the estate tax, avoidance includes strategic charitable giving and using trusts to minimize the taxable value of asset transfers. In contrast, tax “evasion” refers to illegal noncompliance activity like underreporting wealth on an estate tax return.
There is reason to believe that both avoidance and evasion have played a role in falling estate tax revenues since 2000. In 1990, changes were made to provisions in grantor-retained annuity trust (GRAT) law, which created a mechanism for sheltering large unrealized gains on assets from gift and estate tax purposes.2 The use of GRATs has grown more popular since courts affirmed the vehicle’s legal standing in 2000. One estimate suggests this form of tax planning has cost the federal government over $100 billion in forgone revenue.
A potential source of evasion is the underreporting of gifts. Some evidence suggests that over 80 percent of returns filed for gifts of over $1 million understated the true value of the gift. The IRS has limited capacity to audit gift tax returns. This capacity was further constrained in 1997 with passage of the Taxpayer Relief Act (1997), which gives the IRS just three years to audit a gift tax return or accept it as filed. Well-known audit capacity limitations at the IRS encourage taxpayers to understate gifts on returns. This underreporting is likely further encouraged by the decline in real IRS funding since 2010. Despite increased workload (measured by returns filed), total staffing has declined over the past decade, and the audit rate on total returns has declined by 58 percent since 2010.
Tax avoidance and evasion are not easily observable and must be estimated. One approach is to compare observed gross estate on tax returns with the amount expected given the distribution of assets and mortality rates.3 If wealth and the demographic attributes associated with mortality are measured consistently over time, a falling ratio of actual gross estate to expected gross estate indicates an increase in avoidance and/or evasion. Changes in the composition of estate tax returns over time, due to repeated increases in the exemption, present a practical complication for measurement because lower-value estate groups tend to have lower ratios. A regression that controls for estate composition reveals a statistically significant upward trend in avoidance and/or evasion, which we use to generate counterfactual scenarios where avoidance and evasion are held fixed at filing year 2001 levels (factor 3A). Figure 4 visualizes this trend by plotting the ratio of actual gross estate to expected gross estate and restricting the data to estates worth at least $5M through filing year 2018—a sample without selection bias.

Our simulations suggest that tax planning acted as a modest drag on estate tax revenues over the last two decades. The quantitative magnitude of this estimate is more uncertain than that of other factors in this analysis. Interpreting the mismatch between actual and expected gross estate as avoidance requires strong assumptions about the time-consistency of measurement error. If, for example, SCF respondents were more likely to overreport wealth in 2019 than in 2000, then the impact of avoidance is overstated. Nonetheless, we believe these assumptions are sensible for the exercise at hand, and that the estimates are consistent with the qualitative record.
Changes in tax law (factor 3B) played a much larger, and more certain, role in reducing estate tax liability and the number of taxable estates since tax year 2000. Figure 3 shows how changes in tax law contributed increasingly negatively to estate tax revenues over the period.
There remains a small difference between the sum of each factor’s contribution and the actual change in estate tax liability (and taxable returns) since 2000. This residual may be attributable to how the Survey of Consumer Finances (SCF) microdata differentially interacts with modeling factors over time. The residual pattern appears correlated with SCF survey year, suggesting that triennial updates to the distributional content of our microdata are driving some of the discrepancy.
A related but distinct question is: holding all else equal, how much larger would the estate tax be if the last 20 years of tax cuts never happened? Figure 5 plots estimated levels of estate tax liability and the number of taxable estates under a counterfactual scenario where estate tax parameters from 2000 remained in place through tax year 2019. We estimate that the number of taxable estates would have more-than-doubled over this period rather than the actual 98 percent decline. We estimate that the foregone nominal liability totals $649B over this period (roughly 0.2 percent of cumulative GDP).


This section provides details on data sources and methodology for the calculations presented in this brief.
Our basic unit of analysis is simulated person-level wealth held at death. To construct this data, we begin with the Federal Reserve Board’s Survey of Consumer Finances (SCF) Bulletin microdata. The SCF is a triennial survey of households and contains data on the composition of households’ wealth holdings. We aggregate household assets into two categories: financial and nonfinancial assets. To get person-level data, we split married households by distributing 50 percent of total assets to the secondary spouse, the age of whom is assumed to be the same as that of the head.
Because the survey is only conducted every three years and our analysis requires annual data, we impute intra-year data. For each survey year at time  , we create copies of the dataset for years
  and
and  . Each person has a sample weight
  and is categorized into a demographic group based on age and gender. Annualized population growth rates over the triennial period are calculated for a particular demographic group as:
and are applied to for each member of that group in years and . We apply an identical calculation for the growth in average assets values by demographic group between survey years. The result is annual microdata.
Next, we benchmark asset values to those of the Financial Accounts (FA). (This benchmark is necessary because we use the FA data to decompose changes in total assets into saving and revaluations; see the section below for more detail.) Two steps are required to reconcile definitional scope across these data sources. First, we conform asset classification: consumer durables are removed from both sources; private business ownership is reclassified from nonfinancial to financial in the SCF; and defined benefit wealth is removed from the FA. Second, we remove the nonprofit sector from FA data. Asset values in our microdata are then scaled to match annual aggregates in the FA. The result is person-level annual microdata.
The next step in constructing estate microdata is to simulate death by assigning each record a probability of death and then multiplying it by sample weight. The starting point for mortality risk calculations is Centers for Disease Control (CDC) death records. We calculate the number of deaths by age, gender, and marital status and divide by respective population counts from the Current Population Survey (CPS), generating demographic-dependent mortality rates. Applying these mortality rates to our data, however, would overstate estate tax liability because richer people face lower mortality risk all else equal.
To account for an income premium in longevity, we draw on Online Data Table 16 from Chetty et al (2016) which breaks out mortality risk by age, gender, and income percentile (conditional on age and gender) for the years 2000-2014. We calculate a relative mortality advantage for each unconditional income group as:
where  is mortality rate,
  is age,
  is gender,
  is unconditional income percentile, and is year. One complication is that our data requires a wealth-based mortality advantage while the source data is based on income, not wealth. This issue is in part mitigated by the fact that, in the Chetty et al (2016) data, for people aged 62 and older, income is defined as income at age 61 (because after retirement income becomes a weaker proxy for economic advantage). We assume that pre-retirement income percentile is a suitable proxy for wealth percentile when assigning mortality advantage.
One finding of that paper is that the mortality advantage of income is growing over time. Capturing this trend is important for our purposes: if we use a constant average of mortality advantage over the period, then the gap between actual gross estate and expected gross estate will be growing over time, falsely suggesting that avoidance and/or evasion are growing (see below for more detail.) We therefore estimate the trend using the following functional form:

such that the effect of income varies over time, which itself is mediated by gender. The effect of age on mortality advantage is confirmed to be nonlinear: income confers a larger advantage at younger ages, reflecting diminishing marginal returns to costly health interventions as age increases.
We fit values for mortality advantage by age, gender, income, and year and then apply them to the CDC-based demographic-specific mortality rates. The resulting mortality rates are used to generate the dataset of expected estates.
The next step is to calculate estate tax liability. The IRS Statistics of Income (SOI) division offers annual aggregate data tables on estate tax variables by gross estate group and filing year. Critically, for each variable, the tables present dollar amounts as well as the number of returns with nonzero values. The latter allows us to determine the number of taxable estates, a key target in our analysis.
For our purposes the tables contain three key variables: gross estate (total assets of estates filing tax returns), taxable estate (the amount of wealth subject to tax after deductions, including liabilities and charitable gifts); and estate tax paid. For each gross estate group and year, we estimate tax parameters  ,
,  , and
, and  in the following set of equations relating SOI data to our microdata:
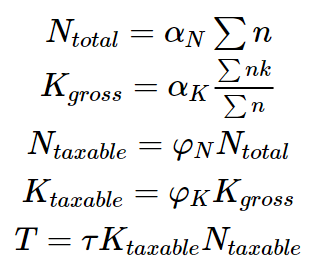
where  is the number of returns (total and taxable),
  is average estate value (gross vs taxable),
  is total estate tax liability;
  is a record’s death weight (its sample weight times its mortality rate ) and
  is a record’s asset holdings. The parameters and , the taxable income rate and the effective estate tax rate respectively, can be interpreted as policy parameters. Their values largely reflect estate tax law including the exemption, rates, and allowable deductions. The parameter , on the other hand, is a scaling factor that conforms gross estate in our calculations to the amount that actually appears on tax returns. It captures two factors. First, it includes any modeling error in our prediction of wealth at death which might arise from mismeasured wealth, inaccurate mortality risk, and more. Second, it captures the effect of avoidance and evasion of estate taxes. If the first factor is negligible, which we assume, then can be interpreted as the effect of tax planning. Measurement error uncorrelated with time does not affect our estimates because the analysis focuses only on changes in the estate tax over time. Only if measurement error is changing over time will we introduce bias into the avoidance/evasion estimates.
Applying these tax parameters to our data gives us, by construction, totals for estate tax liability. The value of this type of parameterization is that it allows to simulate counterfactual scenarios for tax planning and tax policy, explained below.
To determine the extent to which each factor can explain the decline in estate taxes since 2000, we run counterfactual tax calculations under alternative model inputs. We begin by setting all factor parameters to their 2000 level. Then, one by one, we allow the factor's parameters to vary as they actually did over the period, holding every other change up until this factor constant. That is, factors are “stacked” on one another. The resulting difference between estate taxes when this factor is included versus excluded, in each year, measures the marginal impact of that factor.4 The difference between the actual change since 2000 and the sum of marginal factor effects is the unexplained variation.
What does it mean to set a factor to its 2000 level? The implementation varies by factor and is described below.
(1A) Population growth. Sample weights are deflated by the ratio of total population in year
to population in 2000.(1B) Population aging. We calculate each age’s share of the population in year
and in 2000. Sample weights are deflated by the ratio of those shares.(1C) Improved longevity. Mortality rates are set to their 2000 values (by age, gender, marital status, and income group).
(2A) Inflation. Asset values are deflated by the PCE price deflator.
(2B) Real asset price growth. Following Robbins (2018), we use FA data to measure asset price revaluations as the residual after subtracting net acquisitions from the change in the stock of assets. The calculation is done separately for financial and nonfinancial assets in the household and nonprofit sector. The cumulative growth in asset prices through year
is indexed to 2000, which we then deflate by PCE price deflator. This index is used to deflate asset prices in counterfactual scenarios.(2C) Real accumulation of assets. We hold all aforementioned factors at 2000 levels, then calculate the difference between actual gross estate. This approach measures the portion of inflation-adjusted savings accumulation not explained by demographic factors. We estimate the trend in savings through year
, index to 2000, and use this index to deflate asset prices in counterfactual scenarios.(2D) Wealth concentration. Records are assigned to asset percentile groups by year. We calculate each asset group’s share of total assets in year
and in 2000. Sample weights are deflated by the ratio of those shares.(3A) Tax cuts. Tax parameters
and are set to their 2000 levels.(3B) Tax planning. We estimate the following equation:

The parameter estimates suggest richer estates engage in more avoidance/evasion; avoidance/evasion has been growing over time; and the trend in avoidance/evasion is less pronounced for richer estates (perhaps due to higher initial levels). We fit values of for each year and gross estate group, index to 2000, and deflate actual values of by this value in counterfactual scenarios.
This analysis was prepared by John Ricco and Victoria Osorio under the direction of Richard Prisinzano. Alexander Arnon provided helpful feedback. Prepared for the website by Mariko Paulson.
-
While no federal estate tax applied to deaths in 2010, heirs of estates in this calendar year did not qualify for a full step-up in basis on their assets. Estates electing not to pay any estate tax could only receive a step up of up to $1.3 million. Those choosing step-up basis could opt in to paying the 2011 estate tax law. ↩
-
A GRAT is an irrevocable trust, an investment entity created to transfer assets to an heir after it has paid out a series of annuitized payments back to the grantor. The loophole exists because the present value of the annuity stream is calculated using the rate on U.S. Treasuries. If the assets in the trust grow faster than the rate on the UST, the gain on this asset stream is passed to the heir tax-free. ↩
-
Note that this measure does not capture every avoidance channel. For example, charitable giving is a deduction from gross estate and is independent of any relationship between expected gross estate and actual gross estate. ↩
-
Like all stacking analyses, the order in which factors are analyzed will affect the measured effect size. ↩
  Filing year	Liability (% of GDP)	Taxable estates (% of deaths)
  2001	0.0023	0.0215
  2002	0.0020	0.0186
  2003	0.0019	0.0136
  2004	0.0019	0.0128
  2005	0.0018	0.0084
  2006	0.0019	0.0093
  2007	0.0016	0.0072
  2008	0.0017	0.0071
  2009	0.0014	0.0059
  2010	0.0009	0.0027
  2011	0.0002	0.0006
  2012	0.0005	0.0015
  2013	0.0008	0.0018
  2014	0.0010	0.0020
  2015	0.0010	0.0019
  2016	0.0010	0.0019
  2017	0.0011	0.0019
  2018	0.0010	0.0019
  2019	0.0006	0.0009
  2020	0.0004	0.0004
  Tax year	Exemption	Rate
  2000	0.675	0.55
  2001	0.675	0.55
  2002	1	0.5
  2003	1	0.49
  2004	1.5	0.48
  2005	1.5	0.47
  2006	2	0.46
  2007	2	0.45
  2008	2	0.45
  2009	3.5	0.45
  2010
  2011	5	0.35
  2012	5.12	0.35
  2013	5.25	0.4
  2014	5.34	0.4
  2015	5.43	0.4
  2016	5.45	0.4
  2017	5.49	0.4
  2018	11.18	0.4
  2019	11.4	0.4
  Filing year	Factor	Variable	Contribution to change since 2000	Total change since 2000
  2001	1A. Population growth	Estate tax liability (bil $)	0	0
  2001	1B. Population aging	Estate tax liability (bil $)	0	0
  2001	1C. Improved longevity	Estate tax liability (bil $)	0	0
  2001	2A. Inflation	Estate tax liability (bil $)	0	0
  2001	2B. Real asset price growth	Estate tax liability (bil $)	0	0
  2001	2C. Real accumulation of assets	Estate tax liability (bil $)	0	0
  2001	2D. Wealth concentration	Estate tax liability (bil $)	0	0
  2001	3A. Tax cuts	Estate tax liability (bil $)	0	0
  2001	3B. Tax planning	Estate tax liability (bil $)	0	0
  2001	4. Unexplained changes	Estate tax liability (bil $)	0	0
  2001	1A. Population growth	Number of taxable estates (thousands)	0	0
  2001	1B. Population aging	Number of taxable estates (thousands)	0	0
  2001	1C. Improved longevity	Number of taxable estates (thousands)	0	0
  2001	2A. Inflation	Number of taxable estates (thousands)	0	0
  2001	2B. Real asset price growth	Number of taxable estates (thousands)	0	0
  2001	2C. Real accumulation of assets	Number of taxable estates (thousands)	0	0
  2001	2D. Wealth concentration	Number of taxable estates (thousands)	0	0
  2001	3A. Tax cuts	Number of taxable estates (thousands)	0	0
  2001	3B. Tax planning	Number of taxable estates (thousands)	0	0
  2001	4. Unexplained changes	Number of taxable estates (thousands)	0	0
  2002	1A. Population growth	Estate tax liability (bil $)	0.240838007	-2.137789974
  2002	1B. Population aging	Estate tax liability (bil $)	0	-2.137789974
  2002	1C. Improved longevity	Estate tax liability (bil $)	-0.740098976	-2.137789974
  2002	2A. Inflation	Estate tax liability (bil $)	0.556610733	-2.137789974
  2002	2B. Real asset price growth	Estate tax liability (bil $)	-0.613914577	-2.137789974
  2002	2C. Real accumulation of assets	Estate tax liability (bil $)	0.326013201	-2.137789974
  2002	2D. Wealth concentration	Estate tax liability (bil $)	-0.388392393	-2.137789974
  2002	3A. Tax cuts	Estate tax liability (bil $)	-1.070935574	-2.137789974
  2002	3B. Tax planning	Estate tax liability (bil $)	-1.126346213	-2.137789974
  2002	4. Unexplained changes	Estate tax liability (bil $)	0.678435818	-2.137789974
  2002	1A. Population growth	Number of taxable estates (thousands)	0.517938552	-6.743756513
  2002	1B. Population aging	Number of taxable estates (thousands)	0	-6.743756513
  2002	1C. Improved longevity	Number of taxable estates (thousands)	-1.603218641	-6.743756513
  2002	2A. Inflation	Number of taxable estates (thousands)	0.200164714	-6.743756513
  2002	2B. Real asset price growth	Number of taxable estates (thousands)	-0.340683405	-6.743756513
  2002	2C. Real accumulation of assets	Number of taxable estates (thousands)	0.325187307	-6.743756513
  2002	2D. Wealth concentration	Number of taxable estates (thousands)	-0.069053443	-6.743756513
  2002	3A. Tax cuts	Number of taxable estates (thousands)	-2.756529359	-6.743756513
  2002	3B. Tax planning	Number of taxable estates (thousands)	-3.243631653	-6.743756513
  2002	4. Unexplained changes	Number of taxable estates (thousands)	0.226069415	-6.743756513
  2003	1A. Population growth	Estate tax liability (bil $)	0.467519446	-2.736710647
  2003	1B. Population aging	Estate tax liability (bil $)	0.131932835	-2.736710647
  2003	1C. Improved longevity	Estate tax liability (bil $)	-1.557670474	-2.736710647
  2003	2A. Inflation	Estate tax liability (bil $)	1.098386363	-2.736710647
  2003	2B. Real asset price growth	Estate tax liability (bil $)	-1.868344073	-2.736710647
  2003	2C. Real accumulation of assets	Estate tax liability (bil $)	0.440491004	-2.736710647
  2003	2D. Wealth concentration	Estate tax liability (bil $)	-0.814625889	-2.736710647
  2003	3A. Tax cuts	Estate tax liability (bil $)	0.851578965	-2.736710647
  2003	3B. Tax planning	Estate tax liability (bil $)	-2.099418268	-2.736710647
  2003	4. Unexplained changes	Estate tax liability (bil $)	0.613439443	-2.736710647
  2003	1A. Population growth	Number of taxable estates (thousands)	1.047919931	-18.46559911
  2003	1B. Population aging	Number of taxable estates (thousands)	0.970982395	-18.46559911
  2003	1C. Improved longevity	Number of taxable estates (thousands)	-4.024108295	-18.46559911
  2003	2A. Inflation	Number of taxable estates (thousands)	2.152345616	-18.46559911
  2003	2B. Real asset price growth	Number of taxable estates (thousands)	-2.554754277	-18.46559911
  2003	2C. Real accumulation of assets	Number of taxable estates (thousands)	0.349269516	-18.46559911
  2003	2D. Wealth concentration	Number of taxable estates (thousands)	-0.004350885	-18.46559911
  2003	3A. Tax cuts	Number of taxable estates (thousands)	-14.1129979	-18.46559911
  2003	3B. Tax planning	Number of taxable estates (thousands)	-4.570750118	-18.46559911
  2003	4. Unexplained changes	Number of taxable estates (thousands)	2.280844898	-18.46559911
  2004	1A. Population growth	Estate tax liability (bil $)	0.683830426	-1.919746828
  2004	1B. Population aging	Estate tax liability (bil $)	0.465764484	-1.919746828
  2004	1C. Improved longevity	Estate tax liability (bil $)	-2.741811804	-1.919746828
  2004	2A. Inflation	Estate tax liability (bil $)	1.962771511	-1.919746828
  2004	2B. Real asset price growth	Estate tax liability (bil $)	1.473720935	-1.919746828
  2004	2C. Real accumulation of assets	Estate tax liability (bil $)	1.064655989	-1.919746828
  2004	2D. Wealth concentration	Estate tax liability (bil $)	-0.806474513	-1.919746828
  2004	3A. Tax cuts	Estate tax liability (bil $)	-1.476218089	-1.919746828
  2004	3B. Tax planning	Estate tax liability (bil $)	-3.29548895	-1.919746828
  2004	4. Unexplained changes	Estate tax liability (bil $)	0.749503184	-1.919746828
  2004	1A. Population growth	Number of taxable estates (thousands)	1.555536175	-20.48583256
  2004	1B. Population aging	Number of taxable estates (thousands)	2.400052216	-20.48583256
  2004	1C. Improved longevity	Number of taxable estates (thousands)	-6.416459752	-20.48583256
  2004	2A. Inflation	Number of taxable estates (thousands)	4.065539776	-20.48583256
  2004	2B. Real asset price growth	Number of taxable estates (thousands)	6.233714293	-20.48583256
  2004	2C. Real accumulation of assets	Number of taxable estates (thousands)	0.6881939	-20.48583256
  2004	2D. Wealth concentration	Number of taxable estates (thousands)	3.289918941	-20.48583256
  2004	3A. Tax cuts	Number of taxable estates (thousands)	-28.71635278	-20.48583256
  2004	3B. Tax planning	Number of taxable estates (thousands)	-6.980294101	-20.48583256
  2004	4. Unexplained changes	Number of taxable estates (thousands)	3.394318772	-20.48583256
  2005	1A. Population growth	Estate tax liability (bil $)	0.917249987	-1.860107866
  2005	1B. Population aging	Estate tax liability (bil $)	1.779115007	-1.860107866
  2005	1C. Improved longevity	Estate tax liability (bil $)	-3.129573281	-1.860107866
  2005	2A. Inflation	Estate tax liability (bil $)	2.952197094	-1.860107866
  2005	2B. Real asset price growth	Estate tax liability (bil $)	6.344289541	-1.860107866
  2005	2C. Real accumulation of assets	Estate tax liability (bil $)	1.885376691	-1.860107866
  2005	2D. Wealth concentration	Estate tax liability (bil $)	0.648806259	-1.860107866
  2005	3A. Tax cuts	Estate tax liability (bil $)	-10.11313813	-1.860107866
  2005	3B. Tax planning	Estate tax liability (bil $)	-3.9276349	-1.860107866
  2005	4. Unexplained changes	Estate tax liability (bil $)	0.783203862	-1.860107866
  2005	1A. Population growth	Number of taxable estates (thousands)	2.26140815	-31.55786159
  2005	1B. Population aging	Number of taxable estates (thousands)	8.721840232	-31.55786159
  2005	1C. Improved longevity	Number of taxable estates (thousands)	-6.693141046	-31.55786159
  2005	2A. Inflation	Number of taxable estates (thousands)	2.413423364	-31.55786159
  2005	2B. Real asset price growth	Number of taxable estates (thousands)	19.09148185	-31.55786159
  2005	2C. Real accumulation of assets	Number of taxable estates (thousands)	-0.307864176	-31.55786159
  2005	2D. Wealth concentration	Number of taxable estates (thousands)	0.23352134	-31.55786159
  2005	3A. Tax cuts	Number of taxable estates (thousands)	-60.08596756	-31.55786159
  2005	3B. Tax planning	Number of taxable estates (thousands)	-5.300547947	-31.55786159
  2005	4. Unexplained changes	Number of taxable estates (thousands)	8.107984207	-31.55786159
  2006	1A. Population growth	Estate tax liability (bil $)	1.180601434	1.119788266
  2006	1B. Population aging	Estate tax liability (bil $)	1.756824456	1.119788266
  2006	1C. Improved longevity	Estate tax liability (bil $)	-3.864813857	1.119788266
  2006	2A. Inflation	Estate tax liability (bil $)	4.051724004	1.119788266
  2006	2B. Real asset price growth	Estate tax liability (bil $)	9.056616279	1.119788266
  2006	2C. Real accumulation of assets	Estate tax liability (bil $)	3.037977201	1.119788266
  2006	2D. Wealth concentration	Estate tax liability (bil $)	-1.101423822	1.119788266
  2006	3A. Tax cuts	Estate tax liability (bil $)	-8.623830209	1.119788266
  2006	3B. Tax planning	Estate tax liability (bil $)	-5.784199763	1.119788266
  2006	4. Unexplained changes	Estate tax liability (bil $)	1.410312542	1.119788266
  2006	1A. Population growth	Number of taxable estates (thousands)	2.897214503	-29.02969119
  2006	1B. Population aging	Number of taxable estates (thousands)	10.7329229	-29.02969119
  2006	1C. Improved longevity	Number of taxable estates (thousands)	-9.006891288	-29.02969119
  2006	2A. Inflation	Number of taxable estates (thousands)	5.57283435	-29.02969119
  2006	2B. Real asset price growth	Number of taxable estates (thousands)	17.2691474	-29.02969119
  2006	2C. Real accumulation of assets	Number of taxable estates (thousands)	6.649954031	-29.02969119
  2006	2D. Wealth concentration	Number of taxable estates (thousands)	-0.642705882	-29.02969119
  2006	3A. Tax cuts	Number of taxable estates (thousands)	-63.73564679	-29.02969119
  2006	3B. Tax planning	Number of taxable estates (thousands)	-8.13606599	-29.02969119
  2006	4. Unexplained changes	Number of taxable estates (thousands)	9.369545577	-29.02969119
  2007	1A. Population growth	Estate tax liability (bil $)	1.374072355	-1.046403508
  2007	1B. Population aging	Estate tax liability (bil $)	1.08079067	-1.046403508
  2007	1C. Improved longevity	Estate tax liability (bil $)	-4.800467248	-1.046403508
  2007	2A. Inflation	Estate tax liability (bil $)	5.880085603	-1.046403508
  2007	2B. Real asset price growth	Estate tax liability (bil $)	10.25234217	-1.046403508
  2007	2C. Real accumulation of assets	Estate tax liability (bil $)	3.599316331	-1.046403508
  2007	2D. Wealth concentration	Estate tax liability (bil $)	-0.527842499	-1.046403508
  2007	3A. Tax cuts	Estate tax liability (bil $)	-12.15292521	-1.046403508
  2007	3B. Tax planning	Estate tax liability (bil $)	-6.123989743	-1.046403508
  2007	4. Unexplained changes	Estate tax liability (bil $)	0.372214064	-1.046403508
  2007	1A. Population growth	Number of taxable estates (thousands)	3.153073064	-34.40718106
  2007	1B. Population aging	Number of taxable estates (thousands)	8.967580787	-34.40718106
  2007	1C. Improved longevity	Number of taxable estates (thousands)	-11.73471039	-34.40718106
  2007	2A. Inflation	Number of taxable estates (thousands)	13.7525631	-34.40718106
  2007	2B. Real asset price growth	Number of taxable estates (thousands)	22.74281296	-34.40718106
  2007	2C. Real accumulation of assets	Number of taxable estates (thousands)	5.668197345	-34.40718106
  2007	2D. Wealth concentration	Number of taxable estates (thousands)	-3.912038203	-34.40718106
  2007	3A. Tax cuts	Number of taxable estates (thousands)	-69.27350323	-34.40718106
  2007	3B. Tax planning	Number of taxable estates (thousands)	-6.784245548	-34.40718106
  2007	4. Unexplained changes	Number of taxable estates (thousands)	3.013089041	-34.40718106
  2008	1A. Population growth	Estate tax liability (bil $)	1.822182488	1.271515091
  2008	1B. Population aging	Estate tax liability (bil $)	0.934421484	1.271515091
  2008	1C. Improved longevity	Estate tax liability (bil $)	-6.477598174	1.271515091
  2008	2A. Inflation	Estate tax liability (bil $)	4.885282861	1.271515091
  2008	2B. Real asset price growth	Estate tax liability (bil $)	11.8802213	1.271515091
  2008	2C. Real accumulation of assets	Estate tax liability (bil $)	4.284621005	1.271515091
  2008	2D. Wealth concentration	Estate tax liability (bil $)	1.195820594	1.271515091
  2008	3A. Tax cuts	Estate tax liability (bil $)	-13.19279899	1.271515091
  2008	3B. Tax planning	Estate tax liability (bil $)	-7.488837144	1.271515091
  2008	4. Unexplained changes	Estate tax liability (bil $)	3.428199673	1.271515091
  2008	1A. Population growth	Number of taxable estates (thousands)	3.279110339	-34.67929681
  2008	1B. Population aging	Number of taxable estates (thousands)	4.642899064	-34.67929681
  2008	1C. Improved longevity	Number of taxable estates (thousands)	-11.00546859	-34.67929681
  2008	2A. Inflation	Number of taxable estates (thousands)	12.40669515	-34.67929681
  2008	2B. Real asset price growth	Number of taxable estates (thousands)	18.07400069	-34.67929681
  2008	2C. Real accumulation of assets	Number of taxable estates (thousands)	12.47044614	-34.67929681
  2008	2D. Wealth concentration	Number of taxable estates (thousands)	-9.428608792	-34.67929681
  2008	3A. Tax cuts	Number of taxable estates (thousands)	-53.47195969	-34.67929681
  2008	3B. Tax planning	Number of taxable estates (thousands)	-8.321569583	-34.67929681
  2008	4. Unexplained changes	Number of taxable estates (thousands)	-3.324841532	-34.67929681
  2009	1A. Population growth	Estate tax liability (bil $)	2.195549026	-2.888962038
  2009	1B. Population aging	Estate tax liability (bil $)	1.371883195	-2.888962038
  2009	1C. Improved longevity	Estate tax liability (bil $)	-7.11503276	-2.888962038
  2009	2A. Inflation	Estate tax liability (bil $)	7.160702572	-2.888962038
  2009	2B. Real asset price growth	Estate tax liability (bil $)	0.487210293	-2.888962038
  2009	2C. Real accumulation of assets	Estate tax liability (bil $)	3.390331189	-2.888962038
  2009	2D. Wealth concentration	Estate tax liability (bil $)	3.698356627	-2.888962038
  2009	3A. Tax cuts	Estate tax liability (bil $)	-11.46224775	-2.888962038
  2009	3B. Tax planning	Estate tax liability (bil $)	-7.327977775	-2.888962038
  2009	4. Unexplained changes	Estate tax liability (bil $)	4.712263349	-2.888962038
  2009	1A. Population growth	Number of taxable estates (thousands)	3.978026739	-37.11679766
  2009	1B. Population aging	Number of taxable estates (thousands)	4.967190349	-37.11679766
  2009	1C. Improved longevity	Number of taxable estates (thousands)	-11.87168333	-37.11679766
  2009	2A. Inflation	Number of taxable estates (thousands)	17.13177819	-37.11679766
  2009	2B. Real asset price growth	Number of taxable estates (thousands)	0.813209294	-37.11679766
  2009	2C. Real accumulation of assets	Number of taxable estates (thousands)	7.571925112	-37.11679766
  2009	2D. Wealth concentration	Number of taxable estates (thousands)	-0.636299826	-37.11679766
  2009	3A. Tax cuts	Number of taxable estates (thousands)	-49.96347637	-37.11679766
  2009	3B. Tax planning	Number of taxable estates (thousands)	-8.44104755	-37.11679766
  2009	4. Unexplained changes	Number of taxable estates (thousands)	-0.666420269	-37.11679766
  2010	1A. Population growth	Estate tax liability (bil $)	2.487026271	-10.30989592
  2010	1B. Population aging	Estate tax liability (bil $)	1.843980695	-10.30989592
  2010	1C. Improved longevity	Estate tax liability (bil $)	-8.395056565	-10.30989592
  2010	2A. Inflation	Estate tax liability (bil $)	7.605128866	-10.30989592
  2010	2B. Real asset price growth	Estate tax liability (bil $)	0.775831503	-10.30989592
  2010	2C. Real accumulation of assets	Estate tax liability (bil $)	4.131476155	-10.30989592
  2010	2D. Wealth concentration	Estate tax liability (bil $)	3.991506704	-10.30989592
  2010	3A. Tax cuts	Estate tax liability (bil $)	-23.26243351	-10.30989592
  2010	3B. Tax planning	Estate tax liability (bil $)	-4.468247684	-10.30989592
  2010	4. Unexplained changes	Estate tax liability (bil $)	4.980891651	-10.30989592
  2010	1A. Population growth	Number of taxable estates (thousands)	4.666780965	-45.09467837
  2010	1B. Population aging	Number of taxable estates (thousands)	5.774169164	-45.09467837
  2010	1C. Improved longevity	Number of taxable estates (thousands)	-14.6701476	-45.09467837
  2010	2A. Inflation	Number of taxable estates (thousands)	22.95769653	-45.09467837
  2010	2B. Real asset price growth	Number of taxable estates (thousands)	1.172338518	-45.09467837
  2010	2C. Real accumulation of assets	Number of taxable estates (thousands)	5.751325843	-45.09467837
  2010	2D. Wealth concentration	Number of taxable estates (thousands)	-0.278017685	-45.09467837
  2010	3A. Tax cuts	Number of taxable estates (thousands)	-69.11710314	-45.09467837
  2010	3B. Tax planning	Number of taxable estates (thousands)	-3.013859498	-45.09467837
  2010	4. Unexplained changes	Number of taxable estates (thousands)	1.662138536	-45.09467837
  2011	1A. Population growth	Estate tax liability (bil $)	2.948779005	-20.45621997
  2011	1B. Population aging	Estate tax liability (bil $)	3.549539063	-20.45621997
  2011	1C. Improved longevity	Estate tax liability (bil $)	-9.680543123	-20.45621997
  2011	2A. Inflation	Estate tax liability (bil $)	10.32967346	-20.45621997
  2011	2B. Real asset price growth	Estate tax liability (bil $)	3.037200177	-20.45621997
  2011	2C. Real accumulation of assets	Estate tax liability (bil $)	3.300071385	-20.45621997
  2011	2D. Wealth concentration	Estate tax liability (bil $)	3.512400968	-20.45621997
  2011	3A. Tax cuts	Estate tax liability (bil $)	-43.48057944	-20.45621997
  2011	3B. Tax planning	Estate tax liability (bil $)	-1.073387851	-20.45621997
  2011	4. Unexplained changes	Estate tax liability (bil $)	7.100626387	-20.45621997
  2011	1A. Population growth	Number of taxable estates (thousands)	6.114160653	-50.36025194
  2011	1B. Population aging	Number of taxable estates (thousands)	9.34014478	-50.36025194
  2011	1C. Improved longevity	Number of taxable estates (thousands)	-18.5300968	-50.36025194
  2011	2A. Inflation	Number of taxable estates (thousands)	15.53699107	-50.36025194
  2011	2B. Real asset price growth	Number of taxable estates (thousands)	3.670238511	-50.36025194
  2011	2C. Real accumulation of assets	Number of taxable estates (thousands)	4.375940002	-50.36025194
  2011	2D. Wealth concentration	Number of taxable estates (thousands)	-0.443802363	-50.36025194
  2011	3A. Tax cuts	Number of taxable estates (thousands)	-81.30269664	-50.36025194
  2011	3B. Tax planning	Number of taxable estates (thousands)	-0.796167453	-50.36025194
  2011	4. Unexplained changes	Number of taxable estates (thousands)	11.67503629	-50.36025194
  2012	1A. Population growth	Estate tax liability (bil $)	3.142195846	-15.03464735
  2012	1B. Population aging	Estate tax liability (bil $)	4.760810159	-15.03464735
  2012	1C. Improved longevity	Estate tax liability (bil $)	-10.83879115	-15.03464735
  2012	2A. Inflation	Estate tax liability (bil $)	10.86046593	-15.03464735
  2012	2B. Real asset price growth	Estate tax liability (bil $)	0.55083054	-15.03464735
  2012	2C. Real accumulation of assets	Estate tax liability (bil $)	3.981855946	-15.03464735
  2012	2D. Wealth concentration	Estate tax liability (bil $)	4.627418635	-15.03464735
  2012	3A. Tax cuts	Estate tax liability (bil $)	-35.73602234	-15.03464735
  2012	3B. Tax planning	Estate tax liability (bil $)	-3.011107244	-15.03464735
  2012	4. Unexplained changes	Estate tax liability (bil $)	6.627696326	-15.03464735
  2012	1A. Population growth	Number of taxable estates (thousands)	6.698291373	-48.09686018
  2012	1B. Population aging	Number of taxable estates (thousands)	12.63872797	-48.09686018
  2012	1C. Improved longevity	Number of taxable estates (thousands)	-21.17098033	-48.09686018
  2012	2A. Inflation	Number of taxable estates (thousands)	16.0017356	-48.09686018
  2012	2B. Real asset price growth	Number of taxable estates (thousands)	0.180888099	-48.09686018
  2012	2C. Real accumulation of assets	Number of taxable estates (thousands)	7.455037231	-48.09686018
  2012	2D. Wealth concentration	Number of taxable estates (thousands)	-0.516480362	-48.09686018
  2012	3A. Tax cuts	Number of taxable estates (thousands)	-79.70160671	-48.09686018
  2012	3B. Tax planning	Number of taxable estates (thousands)	-2.134418094	-48.09686018
  2012	4. Unexplained changes	Number of taxable estates (thousands)	12.45194504	-48.09686018
  2013	1A. Population growth	Estate tax liability (bil $)	3.175363631	-10.86218007
  2013	1B. Population aging	Estate tax liability (bil $)	5.327887616	-10.86218007
  2013	1C. Improved longevity	Estate tax liability (bil $)	-11.11811365	-10.86218007
  2013	2A. Inflation	Estate tax liability (bil $)	11.30360972	-10.86218007
  2013	2B. Real asset price growth	Estate tax liability (bil $)	4.593218275	-10.86218007
  2013	2C. Real accumulation of assets	Estate tax liability (bil $)	4.83689162	-10.86218007
  2013	2D. Wealth concentration	Estate tax liability (bil $)	4.86110269	-10.86218007
  2013	3A. Tax cuts	Estate tax liability (bil $)	-33.54229058	-10.86218007
  2013	3B. Tax planning	Estate tax liability (bil $)	-5.057103423	-10.86218007
  2013	4. Unexplained changes	Estate tax liability (bil $)	4.757254041	-10.86218007
  2013	1A. Population growth	Number of taxable estates (thousands)	6.834498709	-47.14444356
  2013	1B. Population aging	Number of taxable estates (thousands)	15.11660967	-47.14444356
  2013	1C. Improved longevity	Number of taxable estates (thousands)	-21.88679638	-47.14444356
  2013	2A. Inflation	Number of taxable estates (thousands)	19.48564718	-47.14444356
  2013	2B. Real asset price growth	Number of taxable estates (thousands)	5.728036728	-47.14444356
  2013	2C. Real accumulation of assets	Number of taxable estates (thousands)	8.854096761	-47.14444356
  2013	2D. Wealth concentration	Number of taxable estates (thousands)	-2.033586347	-47.14444356
  2013	3A. Tax cuts	Number of taxable estates (thousands)	-85.37863415	-47.14444356
  2013	3B. Tax planning	Number of taxable estates (thousands)	-2.912616205	-47.14444356
  2013	4. Unexplained changes	Number of taxable estates (thousands)	9.048300474	-47.14444356
  2014	1A. Population growth	Estate tax liability (bil $)	3.391563752	-7.135568503
  2014	1B. Population aging	Estate tax liability (bil $)	5.807291735	-7.135568503
  2014	1C. Improved longevity	Estate tax liability (bil $)	-12.30217123	-7.135568503
  2014	2A. Inflation	Estate tax liability (bil $)	10.25097764	-7.135568503
  2014	2B. Real asset price growth	Estate tax liability (bil $)	11.0310898	-7.135568503
  2014	2C. Real accumulation of assets	Estate tax liability (bil $)	9.238567811	-7.135568503
  2014	2D. Wealth concentration	Estate tax liability (bil $)	2.78868641	-7.135568503
  2014	3A. Tax cuts	Estate tax liability (bil $)	-35.56432914	-7.135568503
  2014	3B. Tax planning	Estate tax liability (bil $)	-6.529050977	-7.135568503
  2014	4. Unexplained changes	Estate tax liability (bil $)	4.751805701	-7.135568503
  2014	1A. Population growth	Number of taxable estates (thousands)	5.683802178	-46.67021419
  2014	1B. Population aging	Number of taxable estates (thousands)	10.4646266	-46.67021419
  2014	1C. Improved longevity	Number of taxable estates (thousands)	-18.85707412	-46.67021419
  2014	2A. Inflation	Number of taxable estates (thousands)	23.22950396	-46.67021419
  2014	2B. Real asset price growth	Number of taxable estates (thousands)	12.24761961	-46.67021419
  2014	2C. Real accumulation of assets	Number of taxable estates (thousands)	16.42972702	-46.67021419
  2014	2D. Wealth concentration	Number of taxable estates (thousands)	-16.22108027	-46.67021419
  2014	3A. Tax cuts	Number of taxable estates (thousands)	-71.9750144	-46.67021419
  2014	3B. Tax planning	Number of taxable estates (thousands)	-3.230719107	-46.67021419
  2014	4. Unexplained changes	Number of taxable estates (thousands)	-4.441605668	-46.67021419
  2015	1A. Population growth	Estate tax liability (bil $)	3.660865395	-6.453912875
  2015	1B. Population aging	Estate tax liability (bil $)	6.688928088	-6.453912875
  2015	1C. Improved longevity	Estate tax liability (bil $)	-13.43030848	-6.453912875
  2015	2A. Inflation	Estate tax liability (bil $)	12.53660076	-6.453912875
  2015	2B. Real asset price growth	Estate tax liability (bil $)	13.20928533	-6.453912875
  2015	2C. Real accumulation of assets	Estate tax liability (bil $)	11.44024521	-6.453912875
  2015	2D. Wealth concentration	Estate tax liability (bil $)	2.376605668	-6.453912875
  2015	3A. Tax cuts	Estate tax liability (bil $)	-40.50204697	-6.453912875
  2015	3B. Tax planning	Estate tax liability (bil $)	-7.482567482	-6.453912875
  2015	4. Unexplained changes	Estate tax liability (bil $)	5.048479602	-6.453912875
  2015	1A. Population growth	Number of taxable estates (thousands)	6.163225373	-46.91193343
  2015	1B. Population aging	Number of taxable estates (thousands)	11.32280422	-46.91193343
  2015	1C. Improved longevity	Number of taxable estates (thousands)	-20.46957518	-46.91193343
  2015	2A. Inflation	Number of taxable estates (thousands)	24.81638033	-46.91193343
  2015	2B. Real asset price growth	Number of taxable estates (thousands)	21.81759615	-46.91193343
  2015	2C. Real accumulation of assets	Number of taxable estates (thousands)	21.24538349	-46.91193343
  2015	2D. Wealth concentration	Number of taxable estates (thousands)	-22.73897505	-46.91193343
  2015	3A. Tax cuts	Number of taxable estates (thousands)	-81.88463768	-46.91193343
  2015	3B. Tax planning	Number of taxable estates (thousands)	-3.459192075	-46.91193343
  2015	4. Unexplained changes	Number of taxable estates (thousands)	-3.724943012	-46.91193343
  2016	1A. Population growth	Estate tax liability (bil $)	4.063610315	-5.230641136
  2016	1B. Population aging	Estate tax liability (bil $)	8.008546637	-5.230641136
  2016	1C. Improved longevity	Estate tax liability (bil $)	-14.49980048	-5.230641136
  2016	2A. Inflation	Estate tax liability (bil $)	13.62160438	-5.230641136
  2016	2B. Real asset price growth	Estate tax liability (bil $)	13.88731993	-5.230641136
  2016	2C. Real accumulation of assets	Estate tax liability (bil $)	12.13124327	-5.230641136
  2016	2D. Wealth concentration	Estate tax liability (bil $)	4.118725947	-5.230641136
  2016	3A. Tax cuts	Estate tax liability (bil $)	-44.28892651	-5.230641136
  2016	3B. Tax planning	Estate tax liability (bil $)	-8.541053844	-5.230641136
  2016	4. Unexplained changes	Estate tax liability (bil $)	6.268089218	-5.230641136
  2016	1A. Population growth	Number of taxable estates (thousands)	6.705767444	-46.61515002
  2016	1B. Population aging	Number of taxable estates (thousands)	13.05702112	-46.61515002
  2016	1C. Improved longevity	Number of taxable estates (thousands)	-21.53222058	-46.61515002
  2016	2A. Inflation	Number of taxable estates (thousands)	26.45724632	-46.61515002
  2016	2B. Real asset price growth	Number of taxable estates (thousands)	22.6818308	-46.61515002
  2016	2C. Real accumulation of assets	Number of taxable estates (thousands)	21.54016503	-46.61515002
  2016	2D. Wealth concentration	Number of taxable estates (thousands)	-12.99418168	-46.61515002
  2016	3A. Tax cuts	Number of taxable estates (thousands)	-95.83344127	-46.61515002
  2016	3B. Tax planning	Number of taxable estates (thousands)	-4.031917463	-46.61515002
  2016	4. Unexplained changes	Number of taxable estates (thousands)	-2.665419732	-46.61515002
  2017	1A. Population growth	Estate tax liability (bil $)	4.220172911	-3.593008294
  2017	1B. Population aging	Estate tax liability (bil $)	8.033651533	-3.593008294
  2017	1C. Improved longevity	Estate tax liability (bil $)	-15.19177795	-3.593008294
  2017	2A. Inflation	Estate tax liability (bil $)	12.12387053	-3.593008294
  2017	2B. Real asset price growth	Estate tax liability (bil $)	22.75251397	-3.593008294
  2017	2C. Real accumulation of assets	Estate tax liability (bil $)	12.70171379	-3.593008294
  2017	2D. Wealth concentration	Estate tax liability (bil $)	6.074705992	-3.593008294
  2017	3A. Tax cuts	Estate tax liability (bil $)	-50.17960753	-3.593008294
  2017	3B. Tax planning	Estate tax liability (bil $)	-9.794222298	-3.593008294
  2017	4. Unexplained changes	Estate tax liability (bil $)	5.665970745	-3.593008294
  2017	1A. Population growth	Number of taxable estates (thousands)	8.595595615	-46.65661741
  2017	1B. Population aging	Number of taxable estates (thousands)	18.50747715	-46.65661741
  2017	1C. Improved longevity	Number of taxable estates (thousands)	-28.41174104	-46.65661741
  2017	2A. Inflation	Number of taxable estates (thousands)	31.96543178	-46.65661741
  2017	2B. Real asset price growth	Number of taxable estates (thousands)	37.84992782	-46.65661741
  2017	2C. Real accumulation of assets	Number of taxable estates (thousands)	15.55622608	-46.65661741
  2017	2D. Wealth concentration	Number of taxable estates (thousands)	-14.55309136	-46.65661741
  2017	3A. Tax cuts	Number of taxable estates (thousands)	-119.3206575	-46.65661741
  2017	3B. Tax planning	Number of taxable estates (thousands)	-4.475410485	-46.65661741
  2017	4. Unexplained changes	Number of taxable estates (thousands)	7.629624563	-46.65661741
  2018	1A. Population growth	Estate tax liability (bil $)	4.00793312	-3.352795815
  2018	1B. Population aging	Estate tax liability (bil $)	7.007532387	-3.352795815
  2018	1C. Improved longevity	Estate tax liability (bil $)	-13.88597925	-3.352795815
  2018	2A. Inflation	Estate tax liability (bil $)	14.11640829	-3.352795815
  2018	2B. Real asset price growth	Estate tax liability (bil $)	25.02346939	-3.352795815
  2018	2C. Real accumulation of assets	Estate tax liability (bil $)	15.10435428	-3.352795815
  2018	2D. Wealth concentration	Estate tax liability (bil $)	6.352738357	-3.352795815
  2018	3A. Tax cuts	Estate tax liability (bil $)	-52.74512391	-3.352795815
  2018	3B. Tax planning	Estate tax liability (bil $)	-11.20770473	-3.352795815
  2018	4. Unexplained changes	Estate tax liability (bil $)	2.87357625	-3.352795815
  2018	1A. Population growth	Number of taxable estates (thousands)	8.731941354	-46.3570958
  2018	1B. Population aging	Number of taxable estates (thousands)	17.67657915	-46.3570958
  2018	1C. Improved longevity	Number of taxable estates (thousands)	-27.29340226	-46.3570958
  2018	2A. Inflation	Number of taxable estates (thousands)	33.43265338	-46.3570958
  2018	2B. Real asset price growth	Number of taxable estates (thousands)	43.7923548	-46.3570958
  2018	2C. Real accumulation of assets	Number of taxable estates (thousands)	17.18360361	-46.3570958
  2018	2D. Wealth concentration	Number of taxable estates (thousands)	-15.41370518	-46.3570958
  2018	3A. Tax cuts	Number of taxable estates (thousands)	-124.9672768	-46.3570958
  2018	3B. Tax planning	Number of taxable estates (thousands)	-5.188688532	-46.3570958
  2018	4. Unexplained changes	Number of taxable estates (thousands)	5.688844649	-46.3570958
  2019	1A. Population growth	Estate tax liability (bil $)	3.825675118	-10.31615406
  2019	1B. Population aging	Estate tax liability (bil $)	6.435093263	-10.31615406
  2019	1C. Improved longevity	Estate tax liability (bil $)	-13.61376775	-10.31615406
  2019	2A. Inflation	Estate tax liability (bil $)	14.81319637	-10.31615406
  2019	2B. Real asset price growth	Estate tax liability (bil $)	20.44273593	-10.31615406
  2019	2C. Real accumulation of assets	Estate tax liability (bil $)	14.81406622	-10.31615406
  2019	2D. Wealth concentration	Estate tax liability (bil $)	4.71367042	-10.31615406
  2019	3A. Tax cuts	Estate tax liability (bil $)	-56.66333679	-10.31615406
  2019	3B. Tax planning	Estate tax liability (bil $)	-5.792612391	-10.31615406
  2019	4. Unexplained changes	Estate tax liability (bil $)	0.70912555	-10.31615406
  2019	1A. Population growth	Number of taxable estates (thousands)	8.600819167	-49.27176655
  2019	1B. Population aging	Number of taxable estates (thousands)	15.31808719	-49.27176655
  2019	1C. Improved longevity	Number of taxable estates (thousands)	-27.18516949	-49.27176655
  2019	2A. Inflation	Number of taxable estates (thousands)	33.26463043	-49.27176655
  2019	2B. Real asset price growth	Number of taxable estates (thousands)	42.96256585	-49.27176655
  2019	2C. Real accumulation of assets	Number of taxable estates (thousands)	15.78689409	-49.27176655
  2019	2D. Wealth concentration	Number of taxable estates (thousands)	-17.60128477	-49.27176655
  2019	3A. Tax cuts	Number of taxable estates (thousands)	-121.7121798	-49.27176655
  2019	3B. Tax planning	Number of taxable estates (thousands)	-1.364771876	-49.27176655
  2019	4. Unexplained changes	Number of taxable estates (thousands)	2.658642681	-49.27176655
  2020	1A. Population growth	Estate tax liability (bil $)	3.933455534	-14.20069686
  2020	1B. Population aging	Estate tax liability (bil $)	5.201173882	-14.20069686
  2020	1C. Improved longevity	Estate tax liability (bil $)	-13.04414637	-14.20069686
  2020	2A. Inflation	Estate tax liability (bil $)	12.46051707	-14.20069686
  2020	2B. Real asset price growth	Estate tax liability (bil $)	30.18223246	-14.20069686
  2020	2C. Real accumulation of assets	Estate tax liability (bil $)	14.80926368	-14.20069686
  2020	2D. Wealth concentration	Estate tax liability (bil $)	6.900686342	-14.20069686
  2020	3A. Tax cuts	Estate tax liability (bil $)	-71.67197977	-14.20069686
  2020	3B. Tax planning	Estate tax liability (bil $)	-3.524429487	-14.20069686
  2020	4. Unexplained changes	Estate tax liability (bil $)	0.552529796	-14.20069686
  2020	1A. Population growth	Number of taxable estates (thousands)	8.870363183	-50.57041277
  2020	1B. Population aging	Number of taxable estates (thousands)	9.968527724	-50.57041277
  2020	1C. Improved longevity	Number of taxable estates (thousands)	-25.38546936	-50.57041277
  2020	2A. Inflation	Number of taxable estates (thousands)	21.679844	-50.57041277
  2020	2B. Real asset price growth	Number of taxable estates (thousands)	59.52041504	-50.57041277
  2020	2C. Real accumulation of assets	Number of taxable estates (thousands)	22.32811414	-50.57041277
  2020	2D. Wealth concentration	Number of taxable estates (thousands)	-23.94221511	-50.57041277
  2020	3A. Tax cuts	Number of taxable estates (thousands)	-125.2956965	-50.57041277
  2020	3B. Tax planning	Number of taxable estates (thousands)	-0.787654693	-50.57041277
  2020	4. Unexplained changes	Number of taxable estates (thousands)	2.473358807	-50.57041277
  Filing year	Actual	Mean	Lower	Upper
  2001	0.717894925	0.77108508	0.703077103	0.839093057
  2002	0.726372892	0.757689435	0.69476393	0.82061494
  2003	0.863985301	0.744293791	0.68625664	0.802330941
  2004	0.772100436	0.730898146	0.677501892	0.7842944
  2005	0.628524222	0.717502501	0.668429427	0.766575576
  2006	0.734074181	0.704106857	0.658947907	0.749265806
  2007	0.731691751	0.690711212	0.648942177	0.732480247
  2008	0.619792184	0.677315568	0.638275442	0.716355693
  2009	0.75367107	0.663919923	0.626801627	0.701038219
  2010	0.605529489	0.650524278	0.614391717	0.686656839
  2011		0.637128634	0.600969078	0.67328819
  2012	0.528747345	0.623732989	0.586535913	0.660930065
  2013	0.566848506	0.610337345	0.57117245	0.649502239
  2014	0.703264649	0.5969417	0.555009458	0.638873942
  2015	0.54980227	0.583546055	0.538193059	0.628899052
  2016	0.549333654	0.570150411	0.520859101	0.619441721
  2017	0.530817053	0.556754766	0.503121478	0.610388055
  2018	0.561882062	0.543359122	0.485070328	0.601647916
  2019	0.664754944	0.529963477	0.466774911	0.593152043
  2020	0.430313554	0.516567832	0.448287794	0.584847871
  Scenario	Variable	Filing year 	Value
  2000 law	Estate tax liability ($ bil)	2001	23.53477188
  2000 law	Estate tax liability ($ bil)	2002	23.59426369
  2000 law	Estate tax liability ($ bil)	2003	22.04590054
  2000 law	Estate tax liability ($ bil)	2004	26.38673209
  2000 law	Estate tax liability ($ bil)	2005	35.71543704
  2000 law	Estate tax liability ($ bil)	2006	39.06259012
  2000 law	Estate tax liability ($ bil)	2007	40.76528333
  2000 law	Estate tax liability ($ bil)	2008	45.48792311
  2000 law	Estate tax liability ($ bil)	2009	39.43603537
  2000 law	Estate tax liability ($ bil)	2010	40.95555716
  2000 law	Estate tax liability ($ bil)	2011	47.6325192
  2000 law	Estate tax liability ($ bil)	2012	47.24725411
  2000 law	Estate tax liability ($ bil)	2013	51.27198582
  2000 law	Estate tax liability ($ bil)	2014	58.4925835
  2000 law	Estate tax liability ($ bil)	2015	65.06547346
  2000 law	Estate tax liability ($ bil)	2016	71.1341111
  2000 law	Estate tax liability ($ bil)	2017	79.91559341
  2000 law	Estate tax liability ($ bil)	2018	84.1348047
  2000 law	Estate tax liability ($ bil)	2019	75.674567
  2000 law	Estate tax liability ($ bil)	2020	84.53048428
  2000 law	Number of taxable estates (thousands)	2001	51.84608426
  2000 law	Number of taxable estates (thousands)	2002	51.10248876
  2000 law	Number of taxable estates (thousands)	2003	52.06423316
  2000 law	Number of taxable estates (thousands)	2004	67.05689858
  2000 law	Number of taxable estates (thousands)	2005	85.67473818
  2000 law	Number of taxable estates (thousands)	2006	94.68810585
  2000 law	Number of taxable estates (thousands)	2007	93.49665198
  2000 law	Number of taxable estates (thousands)	2008	78.96031673
  2000 law	Number of taxable estates (thousands)	2009	73.13381052
  2000 law	Number of taxable estates (thousands)	2010	78.88236853
  2000 law	Number of taxable estates (thousands)	2011	83.58469641
  2000 law	Number of taxable estates (thousands)	2012	85.58524889
  2000 law	Number of taxable estates (thousands)	2013	92.99289106
  2000 law	Number of taxable estates (thousands)	2014	80.38160357
  2000 law	Number of taxable estates (thousands)	2015	90.27798058
  2000 law	Number of taxable estates (thousands)	2016	105.096293
  2000 law	Number of taxable estates (thousands)	2017	128.9855349
  2000 law	Number of taxable estates (thousands)	2018	135.6449538
  2000 law	Number of taxable estates (thousands)	2019	125.6512694
  2000 law	Number of taxable estates (thousands)	2020	127.3590227
  Actual law	Estate tax liability ($ bil)	2001	23.53477188
  Actual law	Estate tax liability ($ bil)	2002	21.39698191
  Actual law	Estate tax liability ($ bil)	2003	20.79806123
  Actual law	Estate tax liability ($ bil)	2004	21.61502505
  Actual law	Estate tax liability ($ bil)	2005	21.67466402
  Actual law	Estate tax liability ($ bil)	2006	24.65456015
  Actual law	Estate tax liability ($ bil)	2007	22.48836837
  Actual law	Estate tax liability ($ bil)	2008	24.80628697
  Actual law	Estate tax liability ($ bil)	2009	20.64580984
  Actual law	Estate tax liability ($ bil)	2010	13.22487596
  Actual law	Estate tax liability ($ bil)	2011	3.078551911
  Actual law	Estate tax liability ($ bil)	2012	8.50012453
  Actual law	Estate tax liability ($ bil)	2013	12.67259181
  Actual law	Estate tax liability ($ bil)	2014	16.39920338
  Actual law	Estate tax liability ($ bil)	2015	17.08085901
  Actual law	Estate tax liability ($ bil)	2016	18.30413075
  Actual law	Estate tax liability ($ bil)	2017	19.94176359
  Actual law	Estate tax liability ($ bil)	2018	20.18197607
  Actual law	Estate tax liability ($ bil)	2019	13.21861782
  Actual law	Estate tax liability ($ bil)	2020	9.334075025
  Actual law	Number of taxable estates (thousands)	2001	51.84608426
  Actual law	Number of taxable estates (thousands)	2002	45.10232775
  Actual law	Number of taxable estates (thousands)	2003	33.38048515
  Actual law	Number of taxable estates (thousands)	2004	31.3602517
  Actual law	Number of taxable estates (thousands)	2005	20.28822267
  Actual law	Number of taxable estates (thousands)	2006	22.81639308
  Actual law	Number of taxable estates (thousands)	2007	17.4389032
  Actual law	Number of taxable estates (thousands)	2008	17.16678746
  Actual law	Number of taxable estates (thousands)	2009	14.7292866
  Actual law	Number of taxable estates (thousands)	2010	6.751405892
  Actual law	Number of taxable estates (thousands)	2011	1.485832318
  Actual law	Number of taxable estates (thousands)	2012	3.749224085
  Actual law	Number of taxable estates (thousands)	2013	4.701640704
  Actual law	Number of taxable estates (thousands)	2014	5.175870068
  Actual law	Number of taxable estates (thousands)	2015	4.934150828
  Actual law	Number of taxable estates (thousands)	2016	5.230934245
  Actual law	Number of taxable estates (thousands)	2017	5.189466852
  Actual law	Number of taxable estates (thousands)	2018	5.488988459
  Actual law	Number of taxable estates (thousands)	2019	2.574317717
  Actual law	Number of taxable estates (thousands)	2020	1.275671491